At DecisionPoint.com we watch for what we call "climax days." These are days when large price moves are accompanied by spikes in New Highs or New Lows, Net Advances minus Declines, Net Advancing Volume minus Declining Volume, and SPX Total Volume.
There are two kinds of climaxes: An initiation climax signals that a new trend is probably starting, and an exhaustion climax implies that the current trend will most likely pause for a few days. It could also mean that the trend is over, and that new and opposite trend may begin. This would likely be signaled by an initiation climax in the opposite direction. Each type of climax is also identified as being an upside or downside climax. We can only identify the type of climax after analyzing the context within which it occurs.
For example, on Monday (November 9) there was an upside exhaustion climax. (Since price was in an established up trend, it can't have been an initiation climax.) We can also call it a blowoff, which had the potential for a violent price reversal. So far, all we have is a pause in the up trend with price churning sideways. Since we only have a pause, we should look for the up trend to continue.
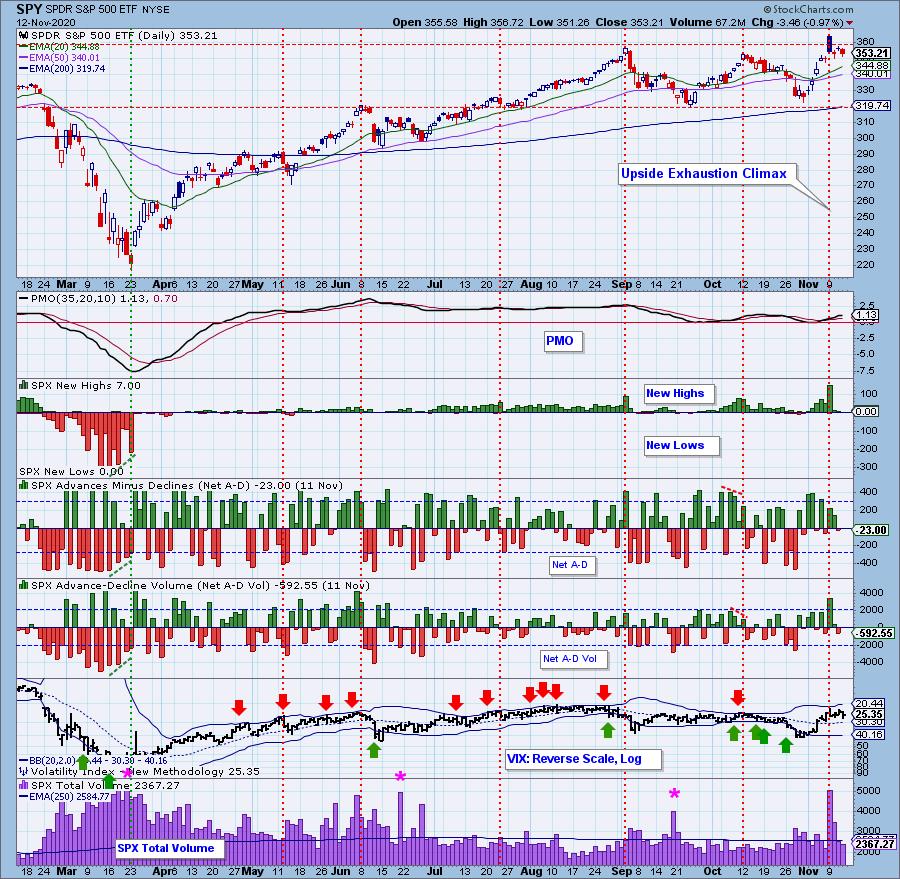
Note that Net Advances minus Declines did not reach climactic levels that day, but all the indicators don't have to be unanimous.
Looking at the rest of the chart it is obvious that climax days are not a rarity, and during the bear market earlier this year there were downside exhaustion climaxes in abundance. It is well to remember that exhaustion in either direction probably signals a pause, not an end to the trend.
Conclusion: By recognizing climax days and identifying the type of climax, we can narrow our expectations of the type of price action that might follow. Recognizing Monday's upside gap as probably being upside exhaustion, one could resist being stampeded into joining the buying frenzy that took place. Since then, we have seen three days of price churn rather than a persistent pullback. My best guess is that prices will move higher soon, but other indicators need to be consulted as regards the condition of the market -- overbought/oversold.


Click here to register in advance for the recurring free DecisionPoint Trading Room! Recordings are available!
Technical Analysis is a windsock, not a crystal ball.
-- Carl Swenlin
___________
Our job is not to see the future, it is to see the present very clearly.
-- Jawad Mian, stray-reflections.com
Helpful DecisionPoint Links:
DecisionPoint Alert Chart List
DecisionPoint Golden Cross/Silver Cross Index Chart List
DecisionPoint Sector Chart List
Price Momentum Oscillator (PMO)
Swenlin Trading Oscillators (STO-B and STO-V)


