On an almost daily basis we hear experts on the subject complaining that this the most overvalued market ever. While our chart doesn't quite confirm that claim, we would agree that it could easily be true using a different methodology. And there is no question that the market is grossly overvalued.
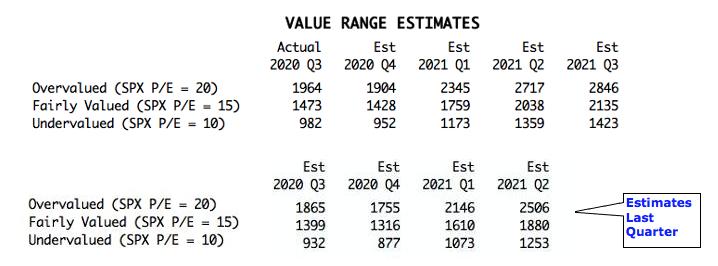
The S&P 500 earnings results for 2020 Q3, based upon GAAP earnings (Generally Accepted Accounting Principals), show that the S&P 500 is, as usual, far above the top of its normal value range. The following chart shows us the normal value range of the S&P 500 Index, indicating where the S&P 500 would have to be in order to have an overvalued P/E of 20 (red line), a fairly valued P/E of 15 (blue line), or an undervalued P/E of 10 (green line). Annotations on the right side of the chart show where the range is projected be based upon earnings estimates for the next four quarters, through 2021 Q3.
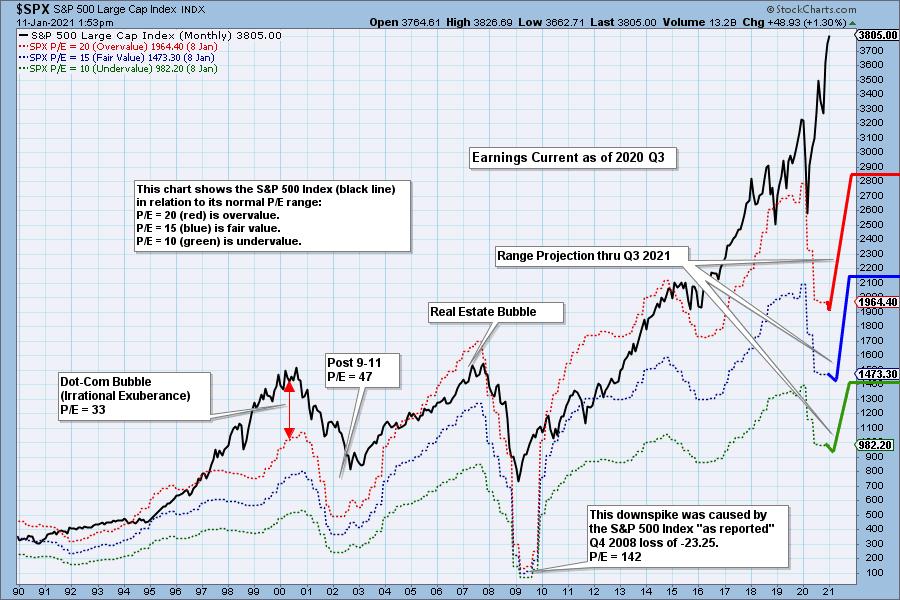
Historically, price has usually remained below the top of the normal value range (red line); however, since about 1998, it has not been uncommon for price to exceed normal overvalue levels, sometimes by a lot. The market has been mostly overvalued since 1992, and it hasn't been undervalued since 1984. We could say that this is the "new normal," except that it isn't normal by GAAP standards.
We use GAAP earnings as the basis for our analysis. The table below shows earnings projections through September 2021. Keep in mind that the P/E estimates are calculated based upon the S&P 500 close on January 8, 2021. They will change daily depending on where the market goes.
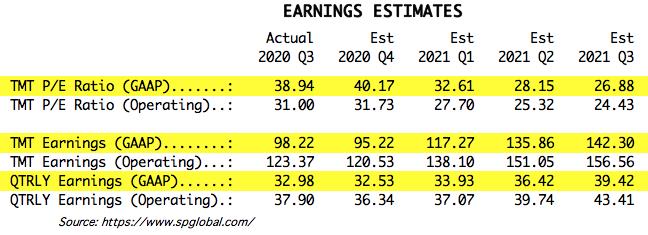
The following table shows where the colored bands will be, based upon earnings estimates. We can also see what the estimates were last quarter. (2021 Q3 is absent because they weren't estimating it three months ago.)
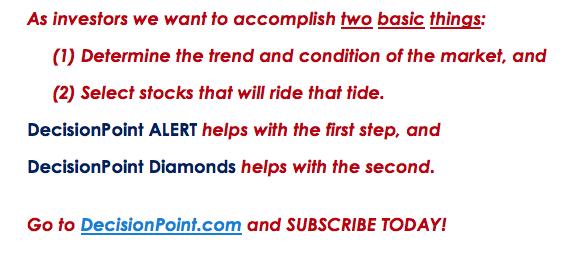
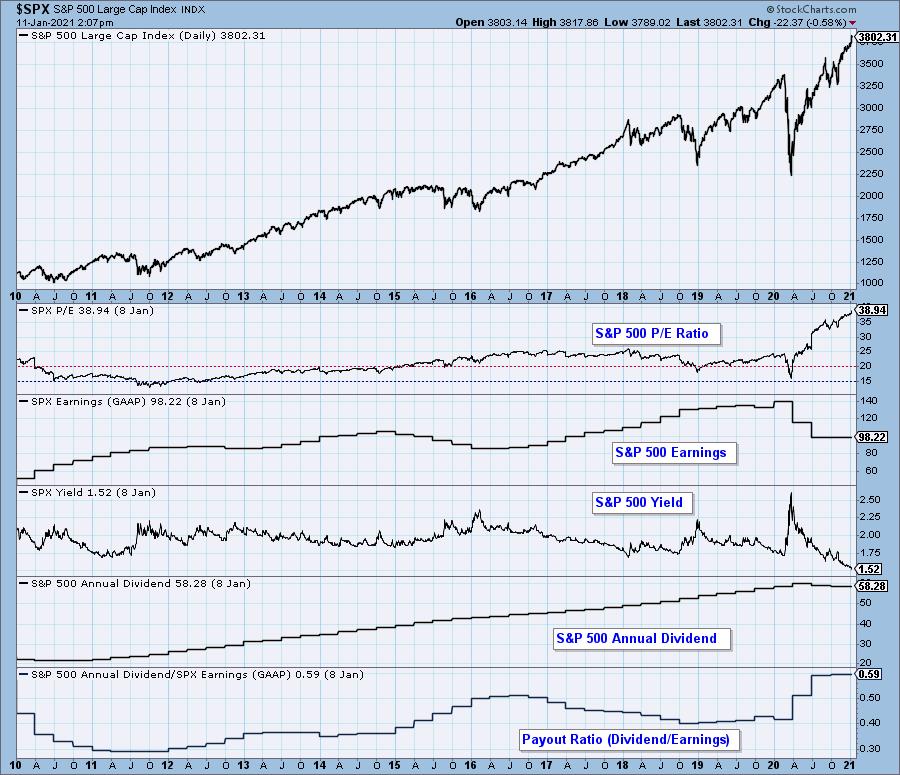
This DecisionPoint chart keeps track of S&P 500 fundamentals, and P/E and yield it is updated daily, not that you need to watch it that closely, but it is up to date when you need it.
CONCLUSION: Overvalued means that people are paying too much for stocks based upon traditional valuation measures. The excess of overvalued markets can persist for years and is not a condition that requires immediate correction. Overvaluation is, however, a condition that can exacerbate declines because there is no intrinsic "value" present to incentivize potential buyers. Or, for one reason or another, overvaluation suddenly begins to matter.
Technical Analysis is a windsock, not a crystal ball.
Helpful DecisionPoint Links:
DecisionPoint Alert Chart List
DecisionPoint Golden Cross/Silver Cross Index Chart List
DecisionPoint Sector Chart List
Price Momentum Oscillator (PMO)
Swenlin Trading Oscillators (STO-B and STO-V)
120


