Flying has been described by pilots as being hours of boredom punctuated by seconds of sheer terror. Attention to detail during the boring hours can possibly reduce the number of terrifying seconds one may be forced to endure. Market analysis requires the same attention to detail, scanning the same set of instruments time and again, preparing for a break in the boredom. In the DecisionPoint ALERT we review the same set of charts every market day, with the intent to detect early warning of significant change ahead. Subscribe now!
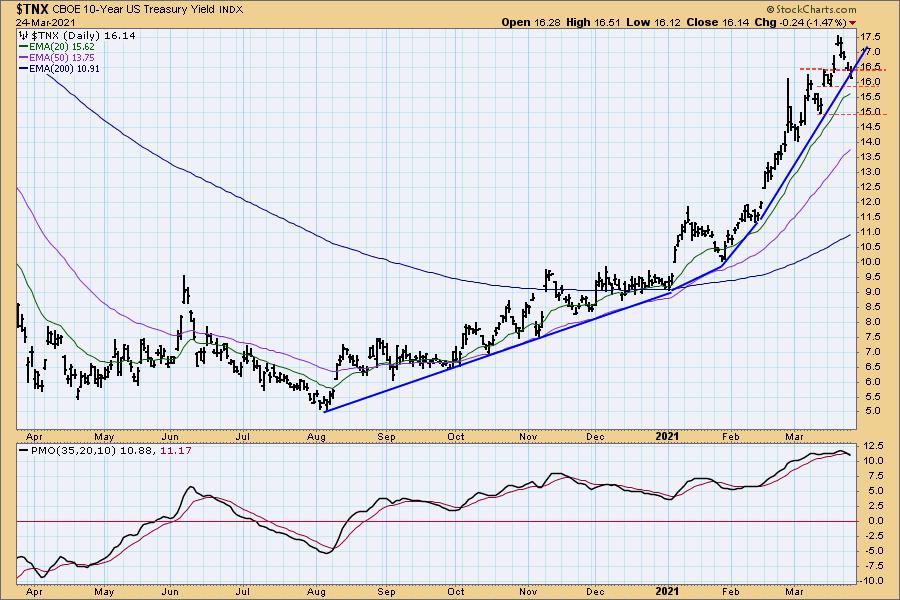
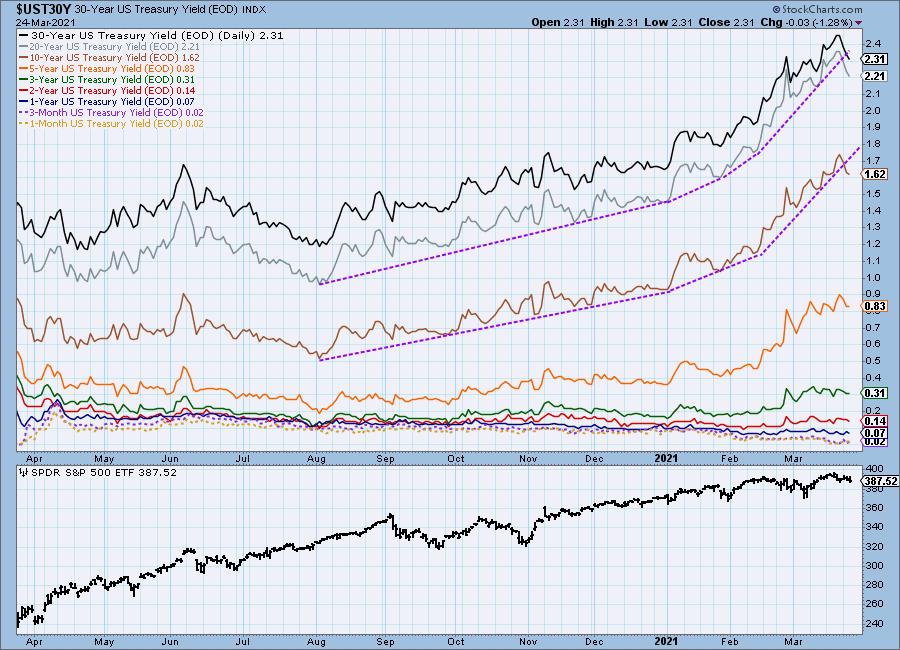
Today the 10-Year Bond broke a rising trend line as well as short-term horizontal support. This was something we anticipated as we watched the trend line accelerate off the August low. The daily PMO is unusually overbought and has crossed down through the signal line. Initial downside targets are 15.90 and 14.95.
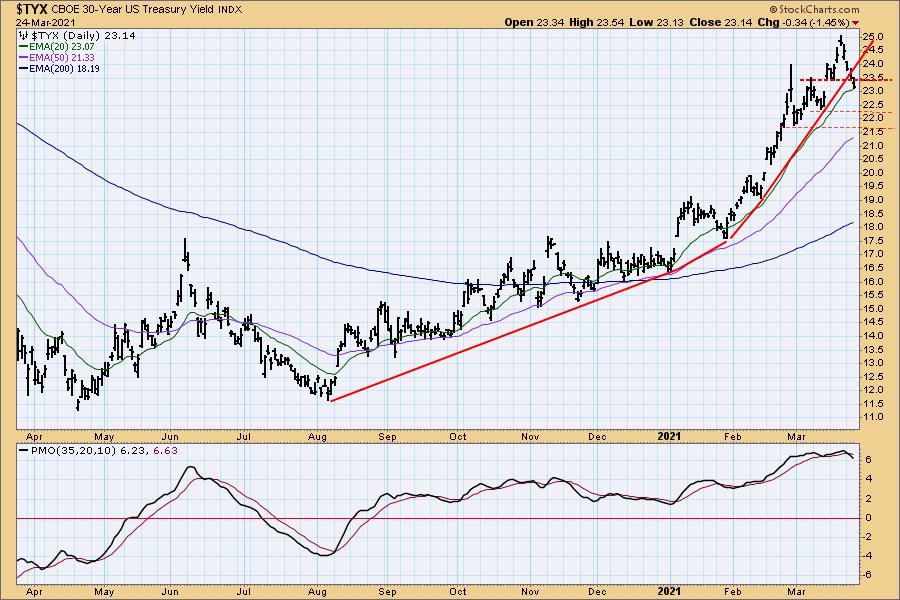
The 30Year Bond broke trend yesterday, and support failed today. The daily PMO is in a similar configuration as the 10-Year, and we expect to see some pullback. We also anticipate that the pullback will be far less than many would like. The first two potential downside targets are 22.20 and 21.70.
The DecisionPoint Alert Weekly Wrap presents an end-of-week assessment of the trend and condition of the Stock Market, the U.S. Dollar, Gold, Crude Oil, and Bonds. The DecisionPoint Alert daily report (Monday through Thursday) is abbreviated and gives updates on the Weekly Wrap assessments.
Watch the latest episode of DecisionPoint on StockCharts TV's YouTube channel here!
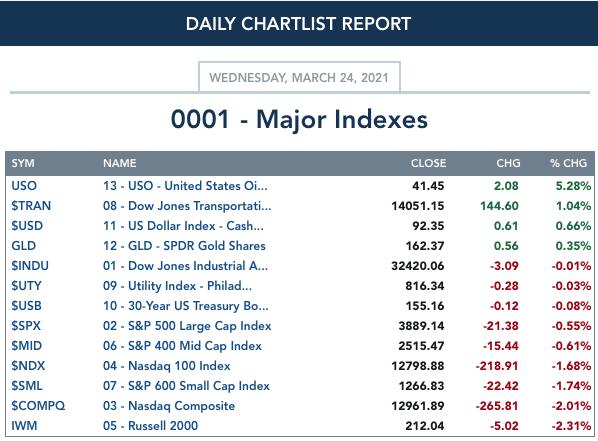
MAJOR MARKET INDEXES
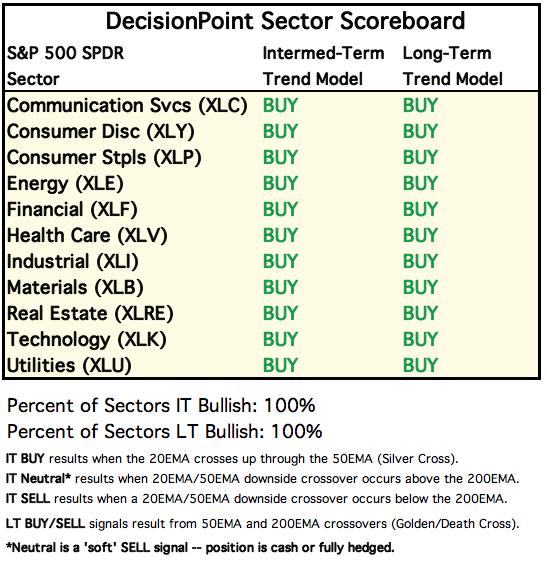
SECTORS
Each S&P 500 Index component stock is assigned to one, and only one, of 11 major sectors. This is a snapshot of the Intermediate-Term (Silver Cross) and Long-Term (Golden Cross) Trend Model signal status for those sectors.
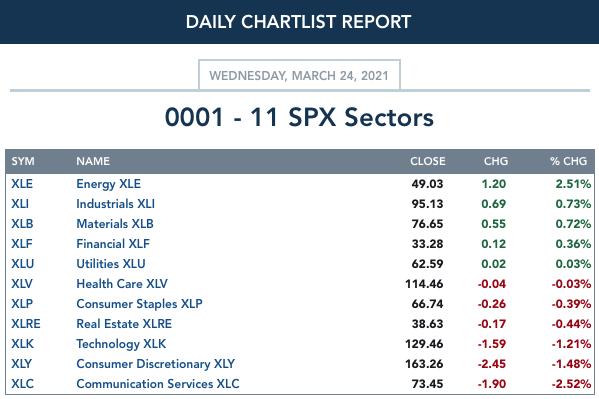
CLICK HERE for Carl's annotated Sector charts.
THE MARKET (S&P 500)
IT Trend Model: BUY as of 5/8/2020
LT Trend Model: BUY as of 6/8/2020
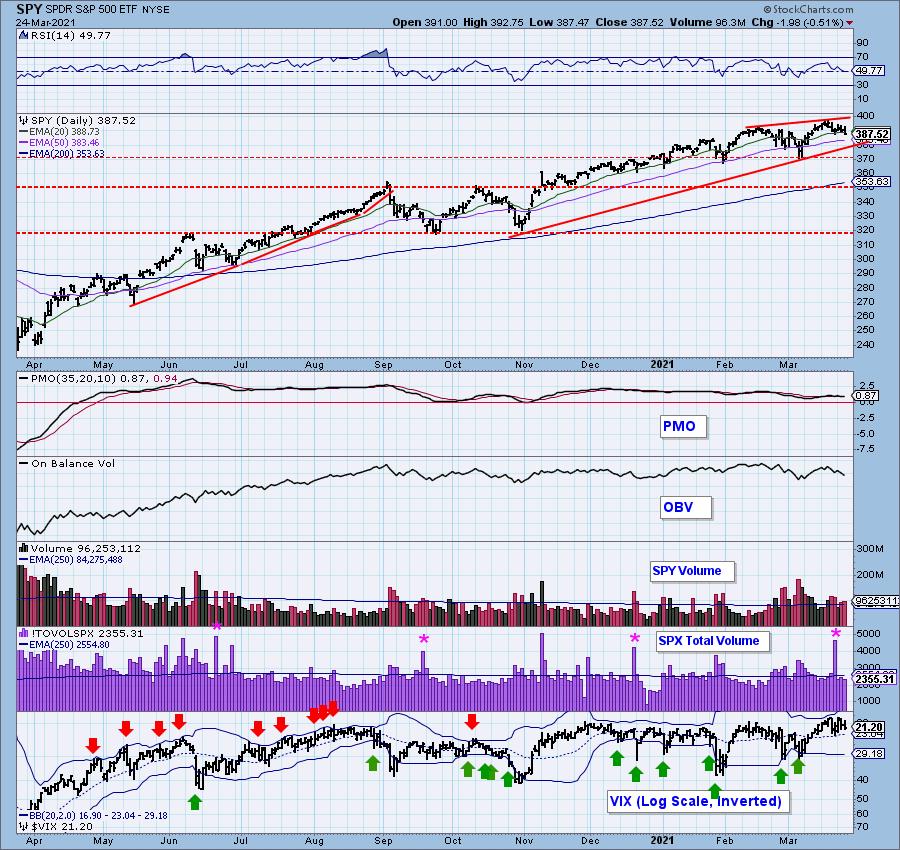
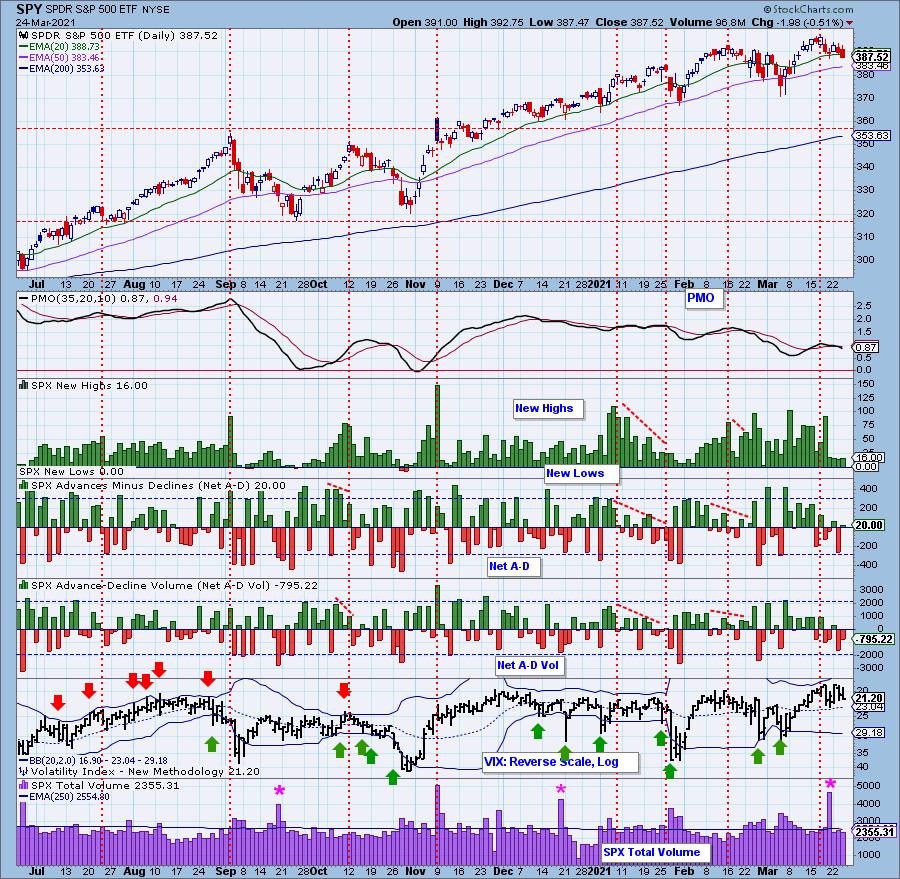
SPY Daily Chart: With crosscurrents in energy and interest rates, the market appears to be double topping, albeit with great reluctance.
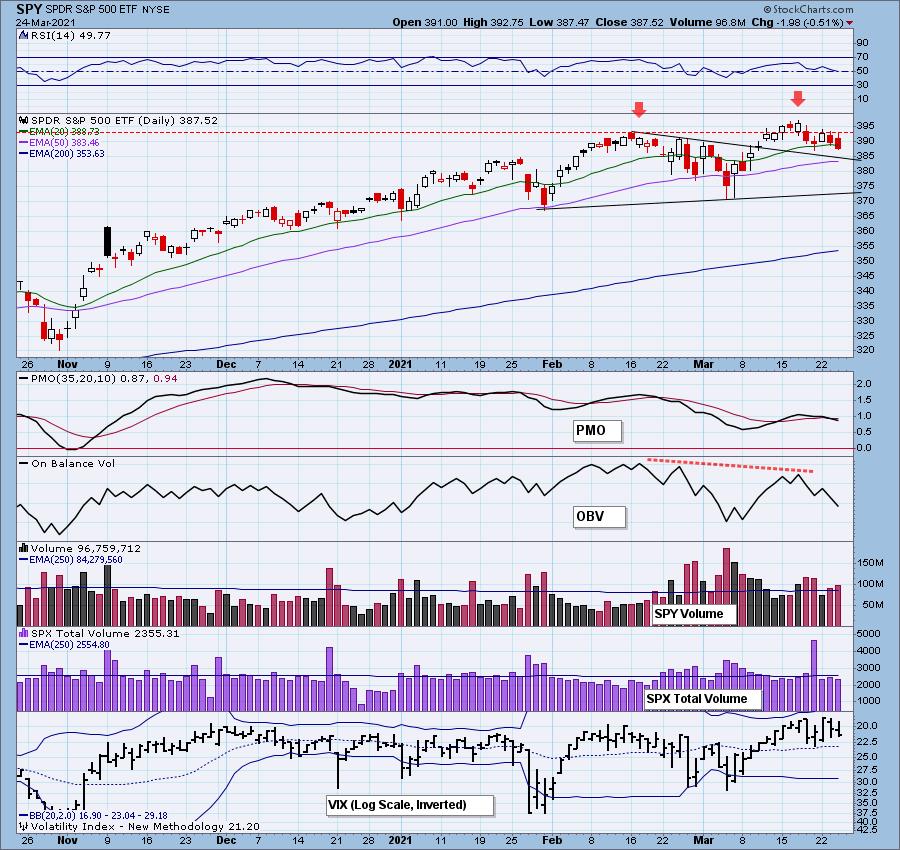
The bearish rising wedge rules the chart.

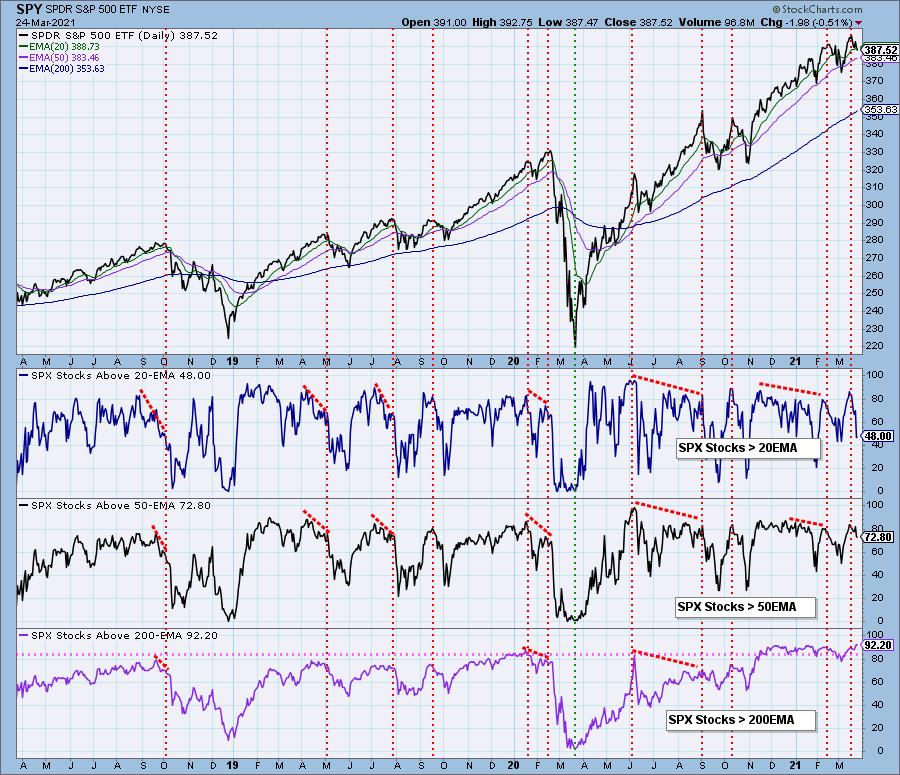
Participation: The following chart uses different methodologies for objectively showing the depth and trend of participation for intermediate- and long-term time frames.
- The Silver Cross Index (SCI) shows the percentage of SPX stocks on IT Trend Model BUY signals (20-EMA > 50-EMA).
- The Golden Cross Index (GCI) shows the percentage of SPX stocks on LT Trend Model BUY signals (50-EMA > 200-EMA).
- The Bullish Percent Index (BPI) shows the percentage of SPX stocks on Point & Figure BUY signals.
The Silver Cross Index and BPI are somewhat weaker than we would like, but we don't see the negative divergences like there were just prior to the February top.
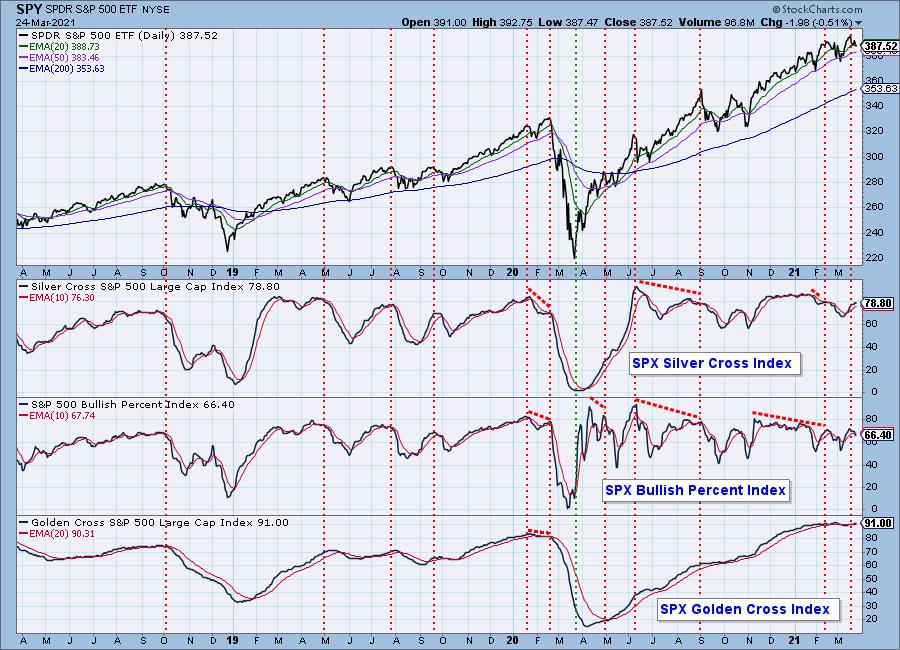
These indicators are just beginning to correct.
Climax Analysis: There were no climactic readings today.
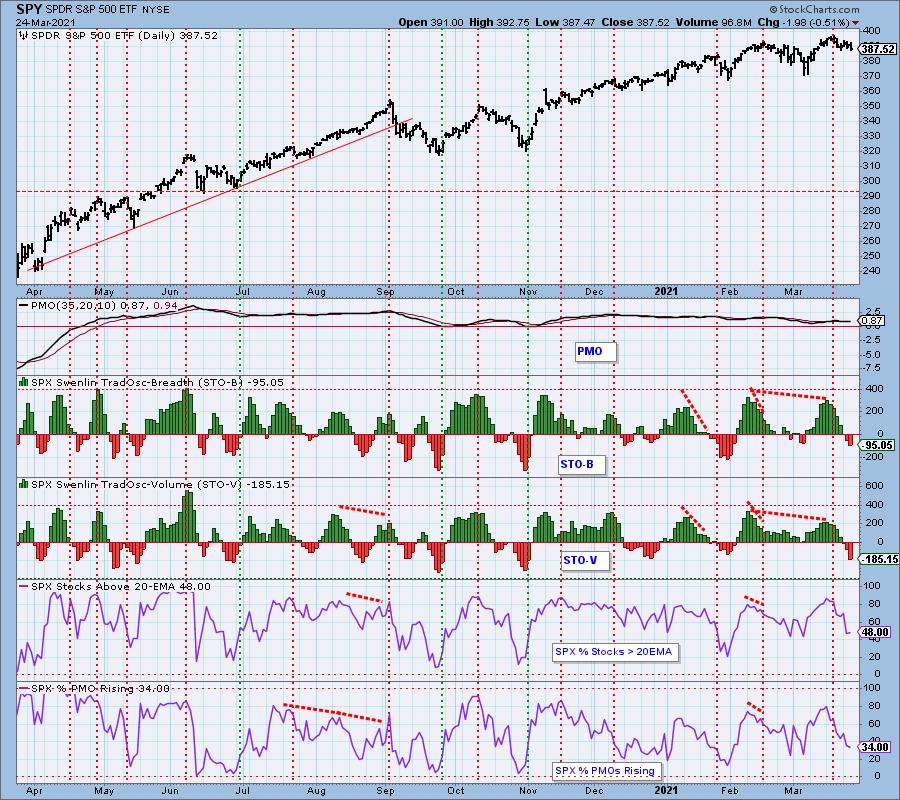
Short-Term Market Indicators: The short-term market trend is DOWN and the condition is somewhat OVERSOLD. The STOs have more room to decline, but they are at the bull market lows seen in the last four months.
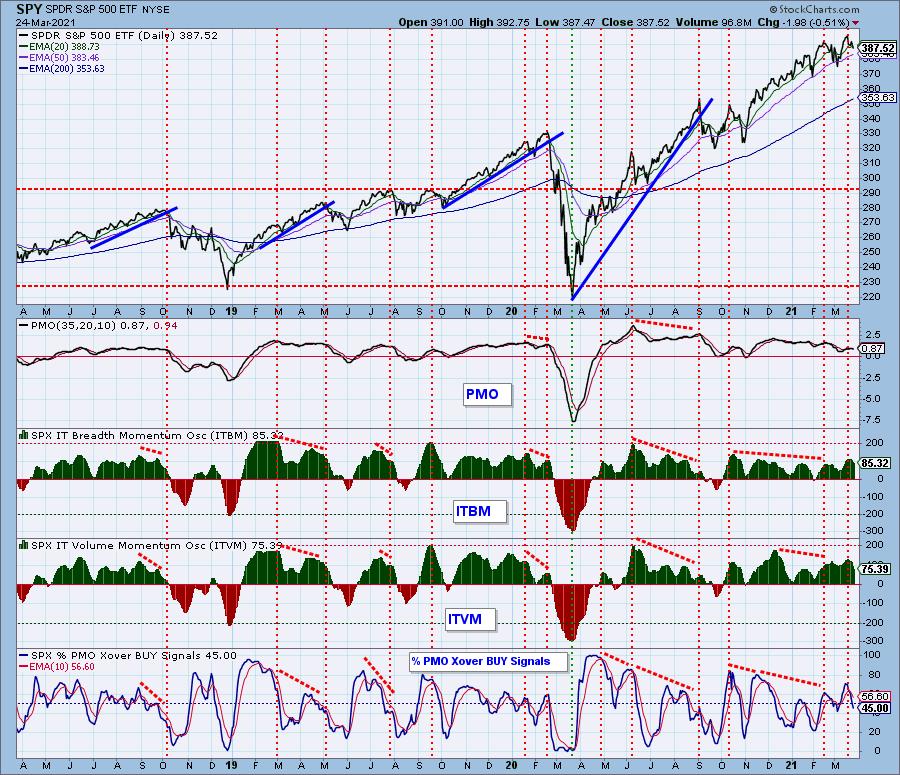
Intermediate-Term Market Indicators: The intermediate-term market trend is UP and the condition is OVERBOUGHT. The market bias is BULLISH. The ITBM and ITVM are falling, confirming price movement. They have a lot farther down to go, even considering their bull market ranges.
CONCLUSION: While short-term indicators allow for a bounce, intermediate-term indicators are just beginning to correct from overbought levels, so we believe that there is more downside ahead.
Interest rates have begun a correction, and energy has made an unexpected bounce. Be sure to check those sections of this blog.
Have you subscribed the DecisionPoint Diamonds yet? DP does the work for you by providing handpicked stocks/ETFs from exclusive DP scans! Add it with a discount! Contact support@decisionpoint.com for more information!
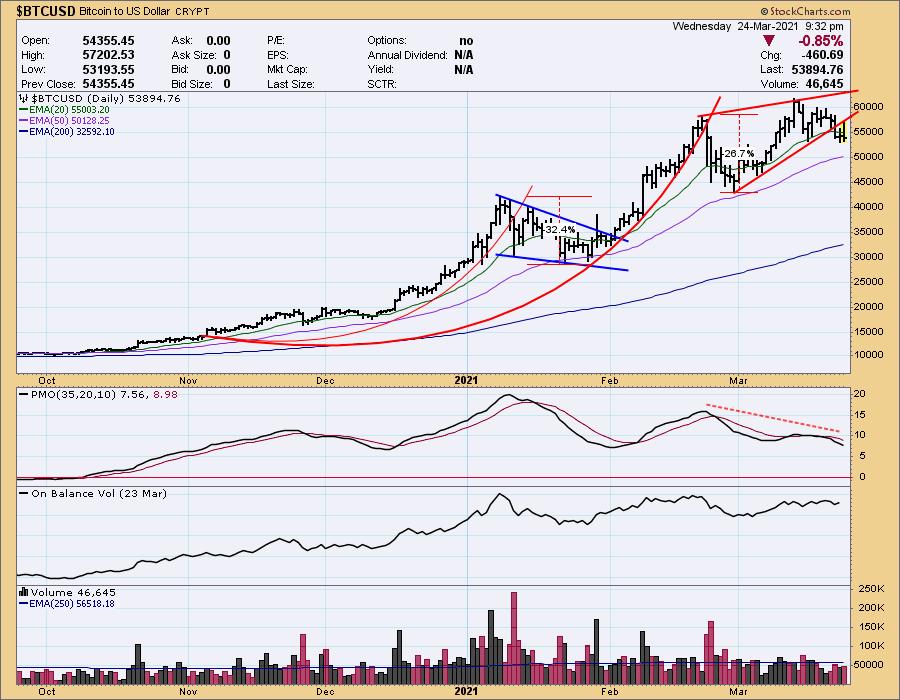
BITCOIN
Today Bitcoin snapped back up to the recently broken trend line, but price experienced an intraday reversal, which implies that there is more downside to come.
INTEREST RATES
Longer-term interest rates have broken rising trend lines, and some more correction should be expected. We have been referring to the recent advance as "parabolic," but we do not expect a parabolic crash to take place.
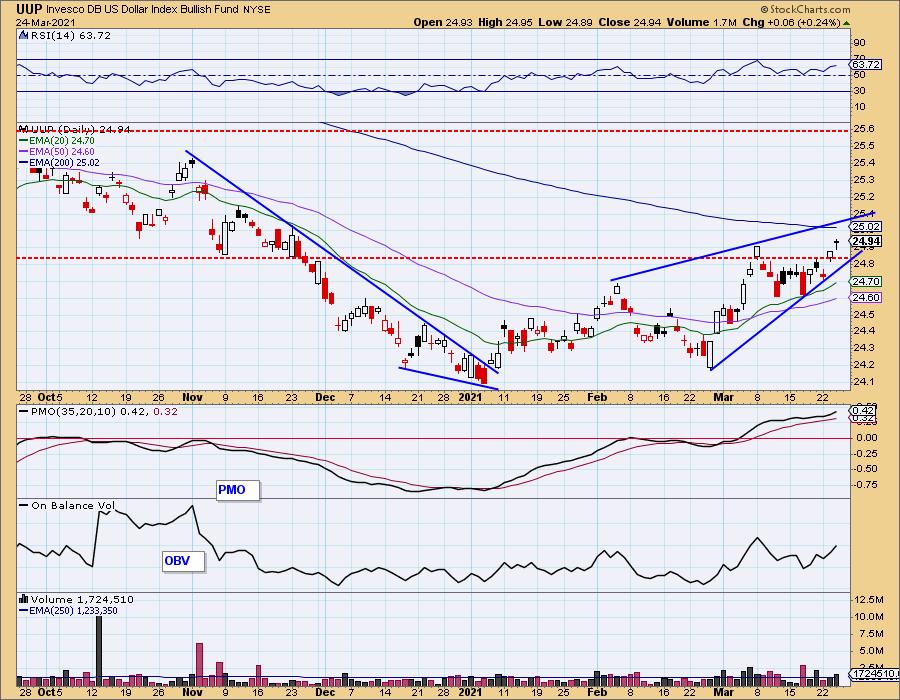
DOLLAR (UUP)
IT Trend Model: BUY as of 3/5/2021
LT Trend Model: SELL as of 7/10/2020
UUP Daily Chart: A rising wedge has formed, so we should expect UUP to resolve downward, but that may take a while.
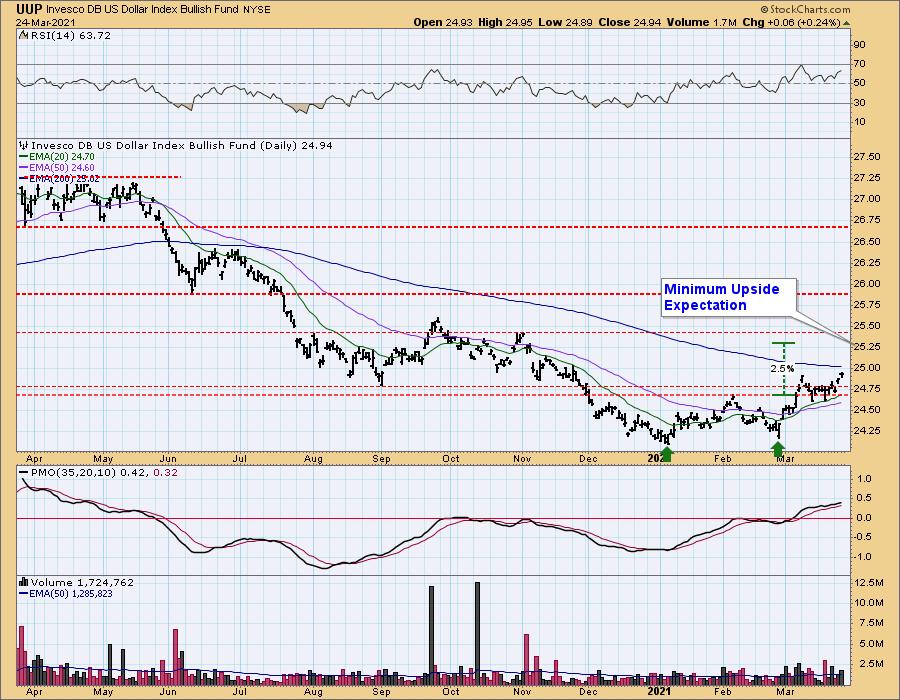
A double bottom has formed, and the confirmation has been penetrated. The minimum upside expectation of about 25.30 throws some shade on the bearish expectation for the rising wedge on the chart above.
GOLD
IT Trend Model: NEUTRAL as of 1/13/2021
LT Trend Model: SELL as of 3/4/2019
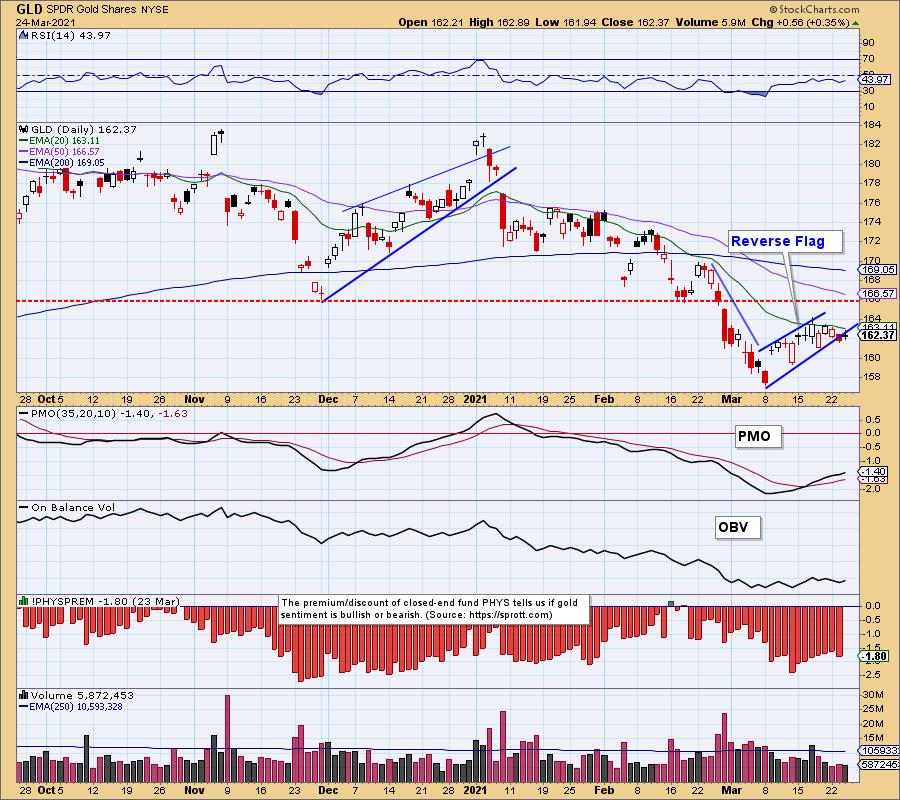
GLD Daily Chart: A bearish reverse flag has formed, but price is drifting sideways, not breaking down yet. This should encourage the bulls.
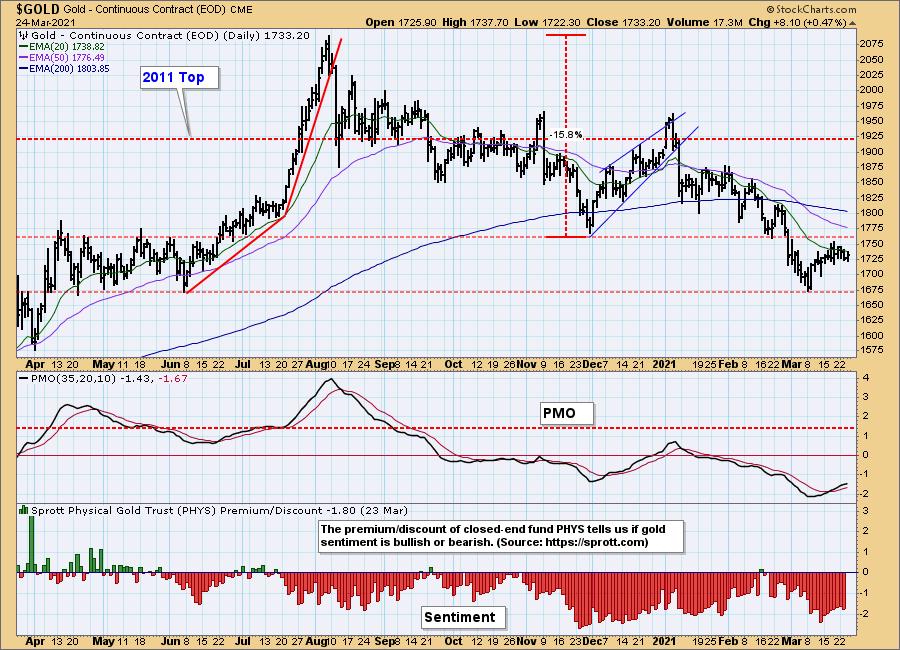
GOLD Daily Chart: The daily PMO is coming off very oversold levels, but some upside price movement needs to kick in or the PMO is going to top.
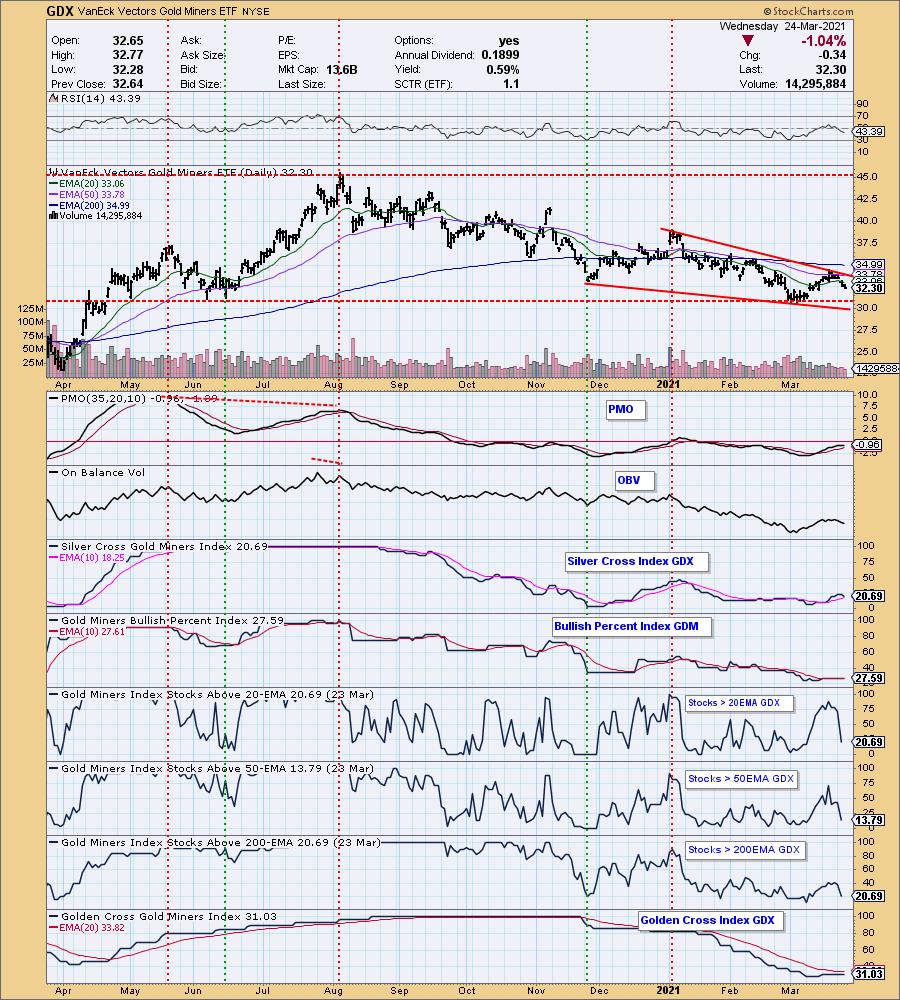
GOLD MINERS Golden and Silver Cross Indexes: We can see declining tops since August, but a falling wedge pattern offers hope that it will resolve upward.
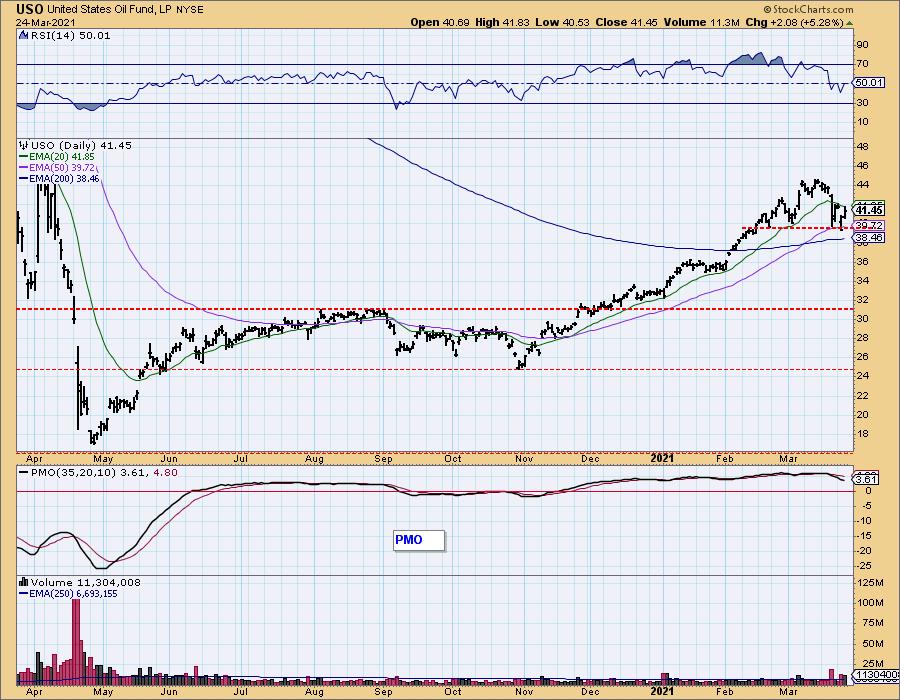
CRUDE OIL (USO)
IT Trend Model: BUY as of 11/23/2020
LT Trend Model: BUY as of 3/9/2021
USO Daily Chart: Although a bounce off support was a reasonable expectation, we were nevertheless surprised at the crude rally today. But the fact that the Suez Canal is blocked by a stranded ship probably has the market anticipating an interruption in the movement of crude oil, LNG, etc. By the same logic, be watching for the blockage to be removed from the Canal, and for energy prices to resume the correction that was in progress.
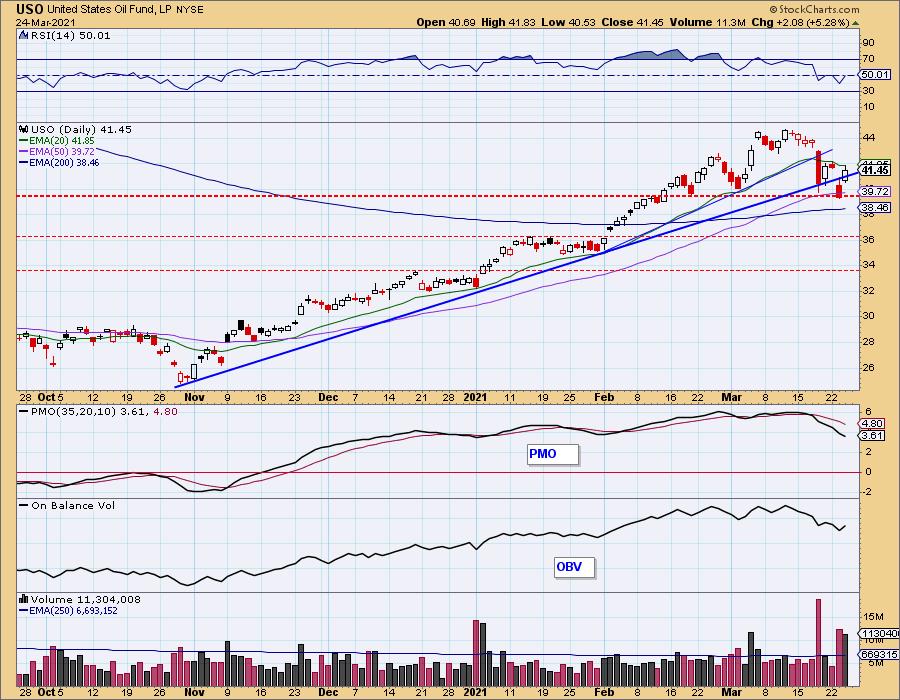
It looks like a head and shoulders pattern is forming on top of the horizontal support line.
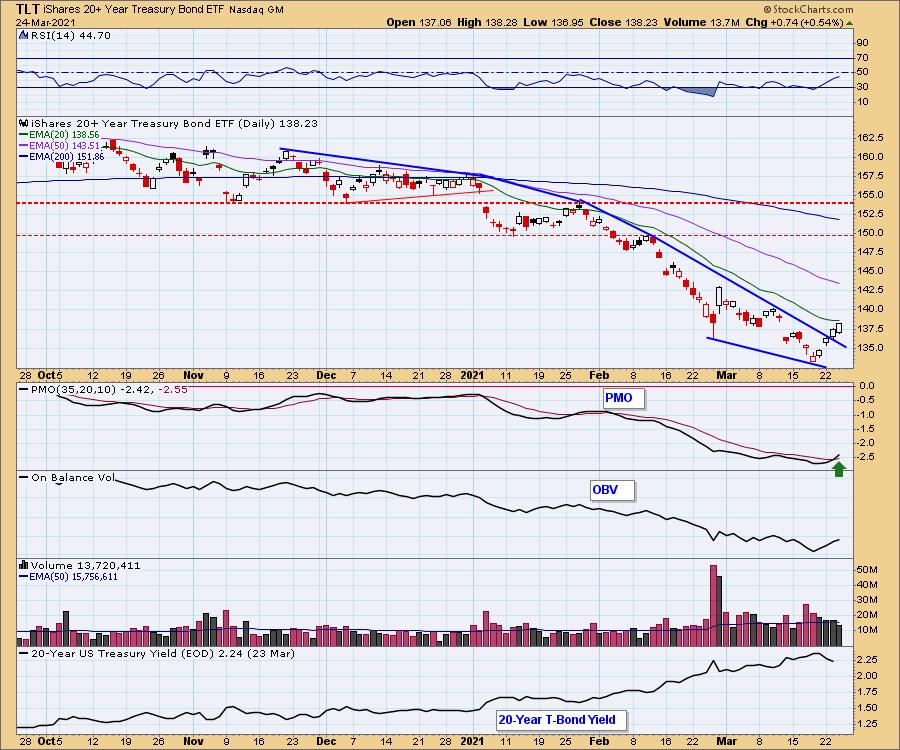
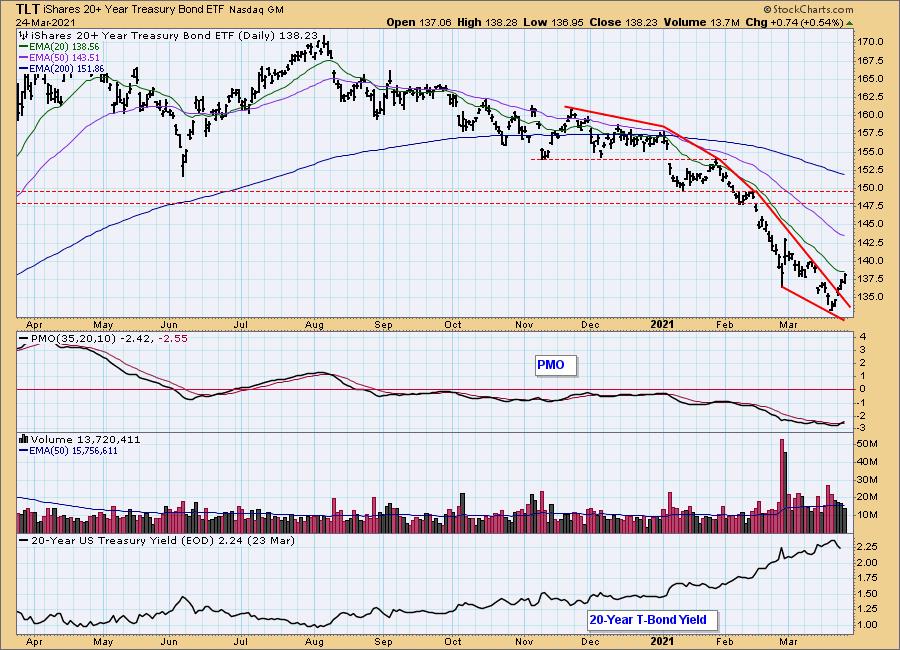
BONDS (TLT)
IT Trend Model: NEUTRAL as of 8/27/2020
LT Trend Model: SELL as of 1/8/2021
TLT Daily Chart: A falling wedge pattern has executed upward, as we normally expect. As interest rates correct, we can anticipate a rally in bonds. But, as we said in the lead comments on interest rates, we don't expect too grand a rally. the daily PMO has bottomed at very oversold levels, and has crossed up through the signal line.
Technical Analysis is a windsock, not a crystal ball.
Disclaimer: This blog is for educational purposes only and should not be construed as financial advice. The ideas and strategies should never be used without first assessing your own personal and financial situation, or without consulting a financial professional. Any opinions expressed herein are solely those of the author, and do not in any way represent the views or opinions of any other person or entity.
NOTE: The signal status reported herein is based upon mechanical trading model signals, specifically, the DecisionPoint Trend Model. They define the implied bias of the price index based upon moving average relationships, but they do not necessarily call for a specific action. They are information flags that should prompt chart review. Further, they do not call for continuous buying or selling during the life of the signal. For example, a BUY signal will probably (but not necessarily) return the best results if action is taken soon after the signal is generated. Additional opportunities for buying may be found as price zigzags higher, but the trader must look for optimum entry points. Conversely, exit points to preserve gains (or minimize losses) may be evident before the model mechanically closes the signal.
Helpful DecisionPoint Links:
DecisionPoint Alert Chart List
DecisionPoint Golden Cross/Silver Cross Index Chart List
DecisionPoint Sector Chart List
Price Momentum Oscillator (PMO)
Swenlin Trading Oscillators (STO-B and STO-V)
DecisionPoint is not a registered investment advisor. Investment and trading decisions are solely your responsibility. DecisionPoint newsletters, blogs or website materials should NOT be interpreted as a recommendation or solicitation to buy or sell any security or to take any specific action.


