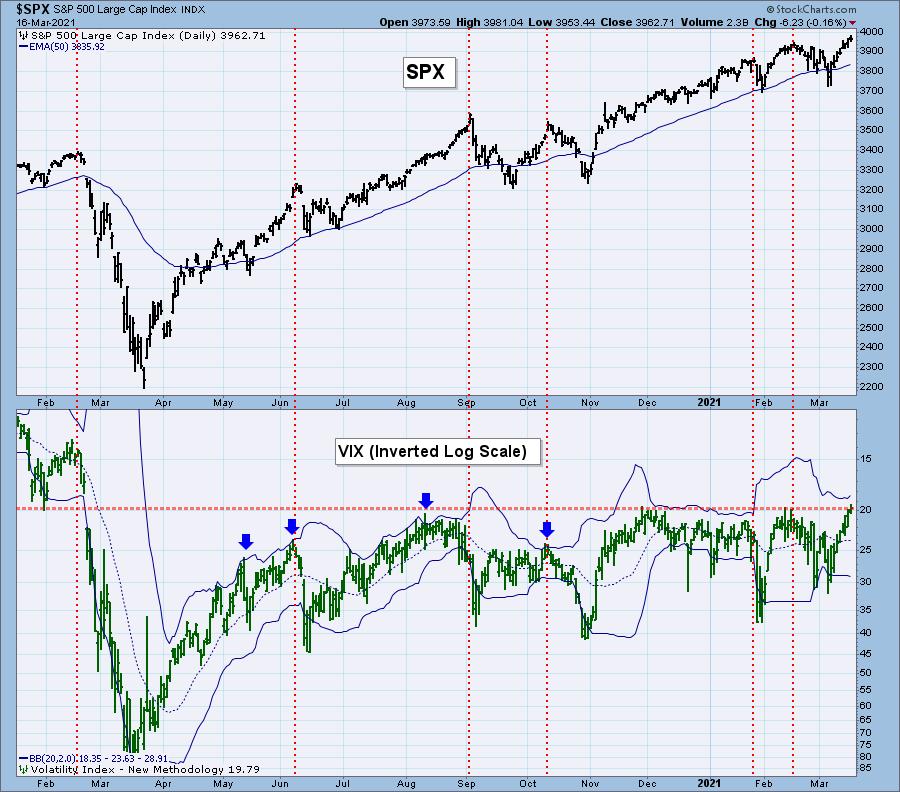
We knew that the VIX readings were sliding lower, but today it finished at 19.79. The VIX has not closed below 20 since the 2020 bull market top.
We invert our VIX because we view the VIX as a sentiment indicator. Sentiment is contrarian, so in order to have overbought territory on top and oversold on the bottom, we invert the scale.
You can see that today's closing reading on the VIX is not only overbought, but the lowest we have seen since the bull market top on February 20th 2020. I have also annotated blue arrows where the VIX has punctured the upper Bollinger Band. Typically that arrives at tops in the market.
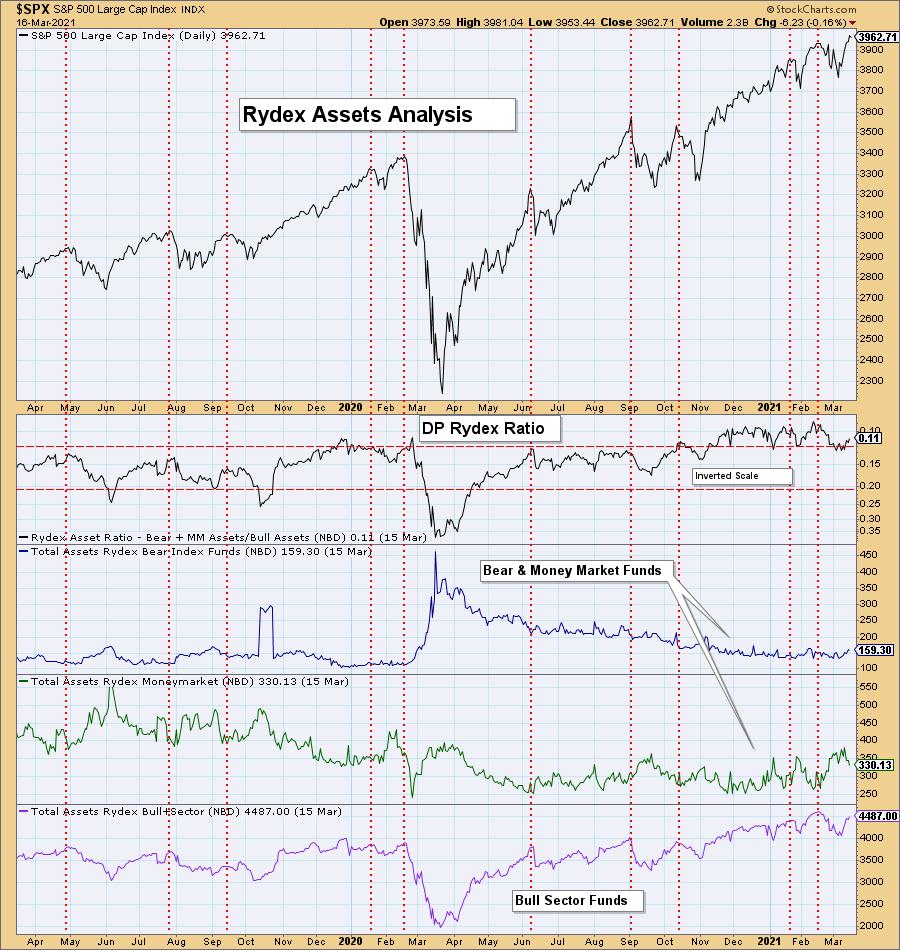
Speaking of sentiment, the Rydex Ratio chart reveals that the Ratio is heading toward very overbought territory. Since the November market low, the Rydex Ratio entered overbought extremes and has been oscillating within. On the bright side it hasn't reached the top of this range, but remember it is extraordinarily overbought. Investors are simply too complacent and bullish. The market is due for a correction, but market participants don't seem to think it is coming. We don't want you to be blindsided.
Free DecisionPoint Trading Room on Mondays, Noon ET

*Click here to register for this recurring free DecisionPoint Trading Room on Mondays at Noon ET!*
=======================================
BELOW is a link to the 3/15 trading room recording:
Topic: DecisionPoint Trading Room
Start Time : Mar 15, 2021 09:00 AM
DP Trading Room RECORDING Link
Access Passcode: 0f$2Pf5z
For best results, copy and paste the access code to avoid typos.
CONCLUSION: VIX readings in overbought territory are dangerous. When market participants are extremely bullish it nearly always marks a top in the market. They can be severe or they can be short-term in nature. Either way it tells us to prepare for volatility and lower prices.
Technical Analysis is a windsock, not a crystal ball.
Happy Charting! - Erin
Disclaimer: This blog is for educational purposes only and should not be construed as financial advice. The ideas and strategies should never be used without first assessing your own personal and financial situation, or without consulting a financial professional. Any opinions expressed herein are solely those of the author, and do not in any way represent the views or opinions of any other person or entity.
NOTE: The signal status reported herein is based upon mechanical trading model signals, specifically, the DecisionPoint Trend Model. They define the implied bias of the price index based upon moving average relationships, but they do not necessarily call for a specific action. They are information flags that should prompt chart review. Further, they do not call for continuous buying or selling during the life of the signal. For example, a BUY signal will probably (but not necessarily) return the best results if action is taken soon after the signal is generated. Additional opportunities for buying may be found as price zigzags higher, but the trader must look for optimum entry points. Conversely, exit points to preserve gains (or minimize losses) may be evident before the model mechanically closes the signal.
Helpful DecisionPoint Links:
DecisionPoint Alert Chart List
DecisionPoint Golden Cross/Silver Cross Index Chart List
DecisionPoint Sector Chart List
Price Momentum Oscillator (PMO)
Swenlin Trading Oscillators (STO-B and STO-V)
DecisionPoint is not a registered investment advisor. Investment and trading decisions are solely your responsibility. DecisionPoint newsletters, blogs, trading rooms or website materials should NOT be interpreted as a recommendation or solicitation to buy or sell any security or to take any specific action.


