On the Bitcoin chart, an important support line at about 30,000 provides the base for a large rounded top. A rounded top is considered to be bearish, with the expectation that, if the support fails, much lower prices are likely. As to how much lower, let's look at that a bit later. For now, today's market action is quite interesting.
At the open Bitcoin was down, penetrating the support line that has been tested numerous times this year. Rather than extend the loss, price reversed to the upside and closed near the day's highs. This does not mean that the trend will be reversed, but it is a good start.
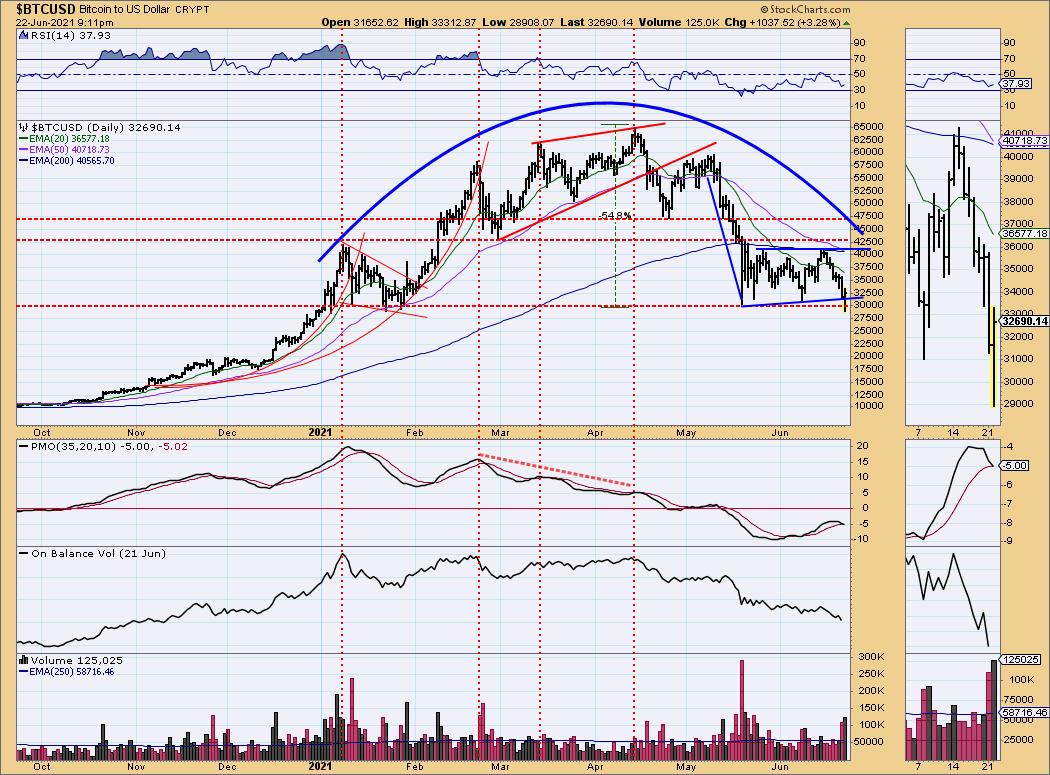
While the rounded top is still bearish, we should also consider that the decline from the April top of 65,000 was about -55%, and declines of approximately -50% are often the full extent of bear market declines, so it is possible that the next trend will be to the upside. Just a thought.

Take advantage of our Spring special! Ending on July 15th!
Get 50% off your first month of DecisionPoint:
Use coupon code: SAVE50 at checkout!
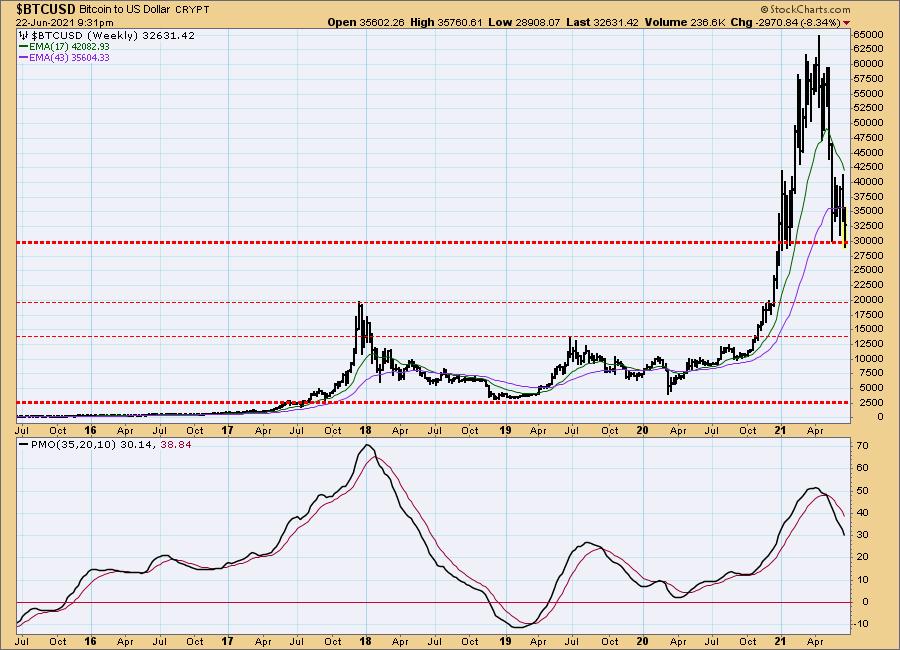
For the moment, the weekly chart shows that Bitcoin is not out of the woods regarding more downside. There is a classic vertical up move off the 2020 low, the kind of move that virtually guarantees a crash. The technical downside target for such a move is back down to the base that preceded the advance. In this case that would be about 2,500. I have drawn thin dotted lines across the 2017 and 2019 tops as potential support levels, but the main target is 2,500.
CONCLUSION: The very short-term implication of today's price action hints that the Bitcoin bear market may be over; however, the longer-term picture calls for much lower prices. If there is follow through on today's upside reversal, that would do a lot to overcome the longer-term bearish picture.

Click here to register in advance for the recurring free DecisionPoint Trading Room! Recordings are available!
Technical Analysis is a windsock, not a crystal ball.
Helpful DecisionPoint Links:
DecisionPoint Alert Chart List
DecisionPoint Golden Cross/Silver Cross Index Chart List
DecisionPoint Sector Chart List
Price Momentum Oscillator (PMO)
Swenlin Trading Oscillators (STO-B and STO-V)
DecisionPoint is not a registered investment advisor. Investment and trading decisions are solely your responsibility. DecisionPoint newsletters, blogs or website materials should NOT be interpreted as a recommendation or solicitation to buy or sell any security or to take any specific action.


