This is a copy of the "subscriber-only" DecisionPoint Weekly Wrap. It is posted each Friday for our subscribers and wraps up the week by analyzing daily and weekly charts. For more information on subscribing, click here.
Intermediate-Term Price Momentum Oscillator (PMO) signals are determined by weekly PMO crossovers. Additionally, they are only recorded after trading is finished on the final trading day of the week. You often will see an IT PMO signal occur during the week and then on Friday disappear. Since these are weekly readings, it is important to log signals at the end of the week.
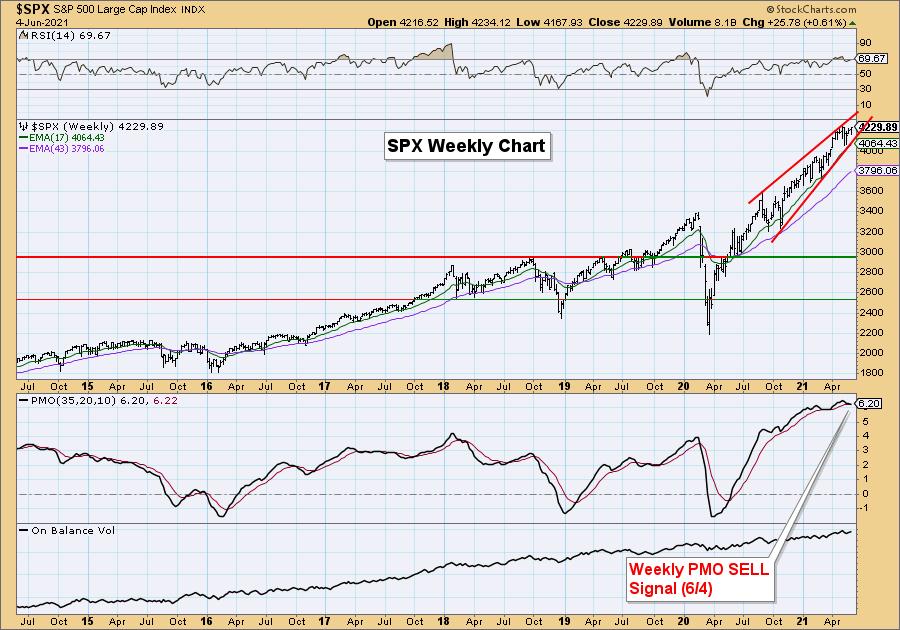
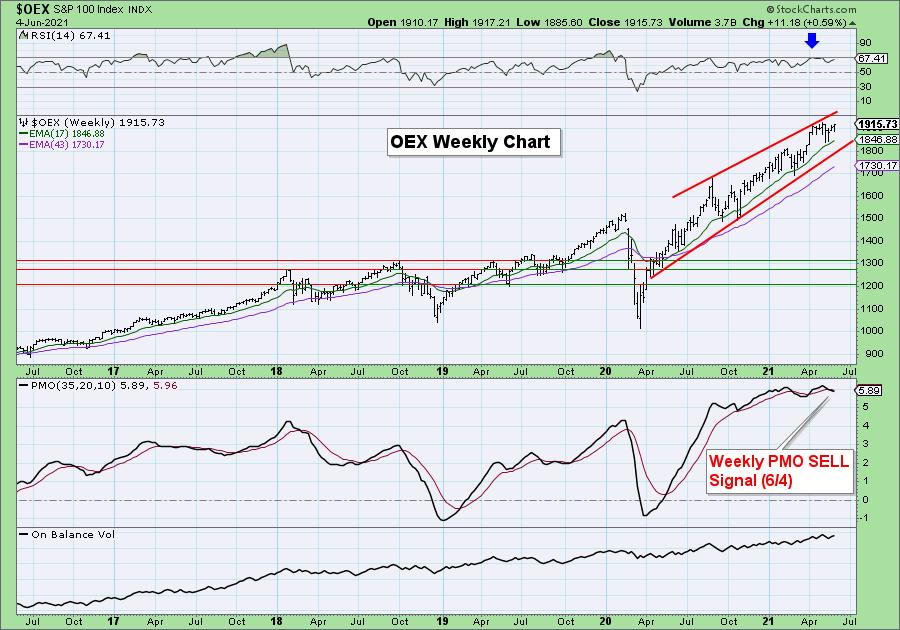
Both the OEX and SPX (and the SPY) had weekly PMO negative crossovers which triggered the SELL signals. Both indexes have been forming long-term bearish rising wedges. Additionally, you'll note that the weekly RSIs are getting overbought. The market is ready for a correction, but we have seen prior weekly PMO declines not amount to much. Just keep it in context that we are seeing this deterioration on the weekly PMOs. The Dow nearly triggered the same IT PMO SELL signal and the NDX has been on a IT PMO SELL signal since April.
The DecisionPoint Alert Weekly Wrap presents an end-of-week assessment of the trend and condition of the Stock Market, the U.S. Dollar, Gold, Crude Oil, and Bonds. The DecisionPoint Alert daily report (Monday through Thursday) is abbreviated and gives updates on the Weekly Wrap assessments.
Watch the latest episode of DecisionPoint on StockCharts TV's YouTube channel here!
MAJOR MARKET INDEXES
For Friday: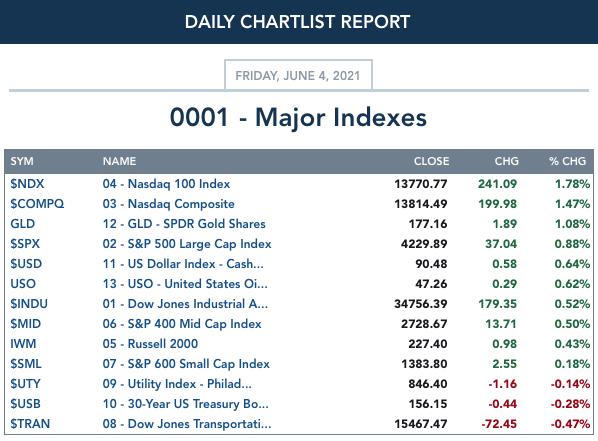
For the week: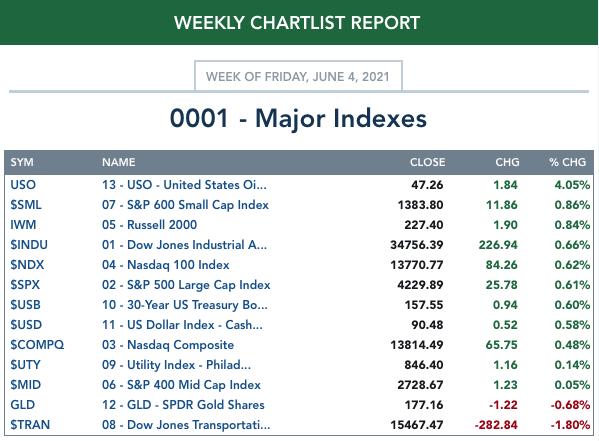
SECTORS
Each S&P 500 Index component stock is assigned to one, and only one, of 11 major sectors. This is a snapshot of the Intermediate-Term (Silver Cross) and Long-Term (Golden Cross) Trend Model signal status for those sectors.
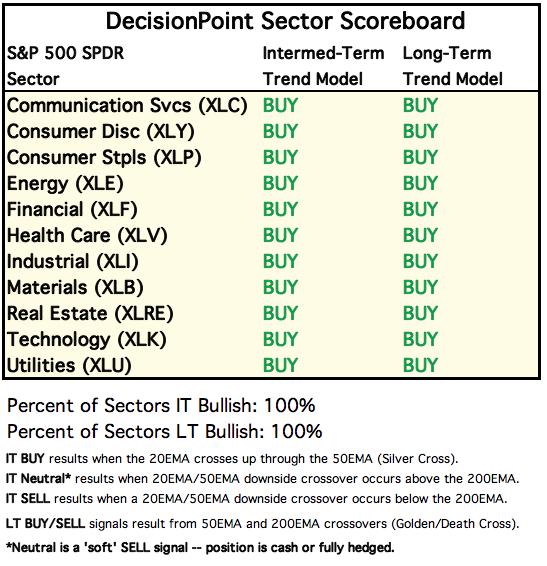
For Today: 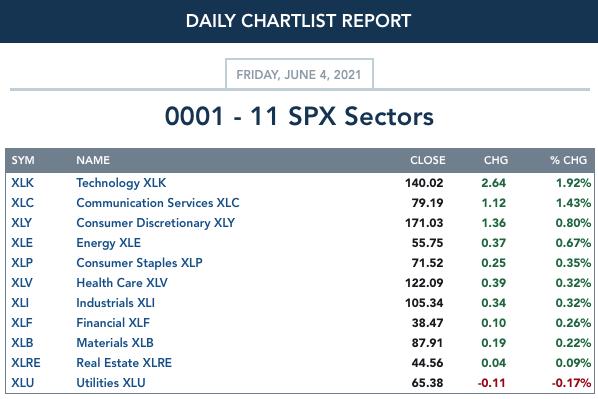
For the Week: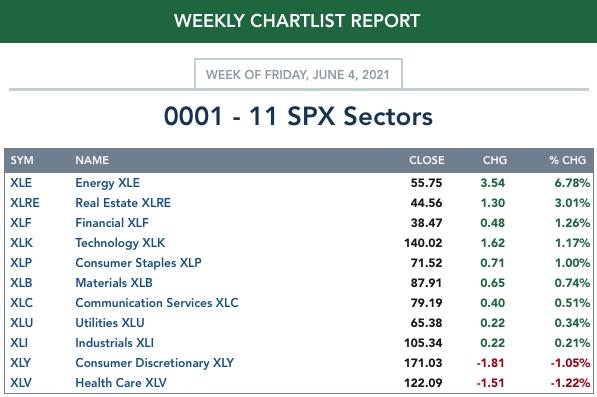
CLICK HERE for Carl's annotated Sector charts.
THE MARKET (S&P 500)
IT Trend Model: BUY as of 5/8/2020
LT Trend Model: BUY as of 6/8/2020
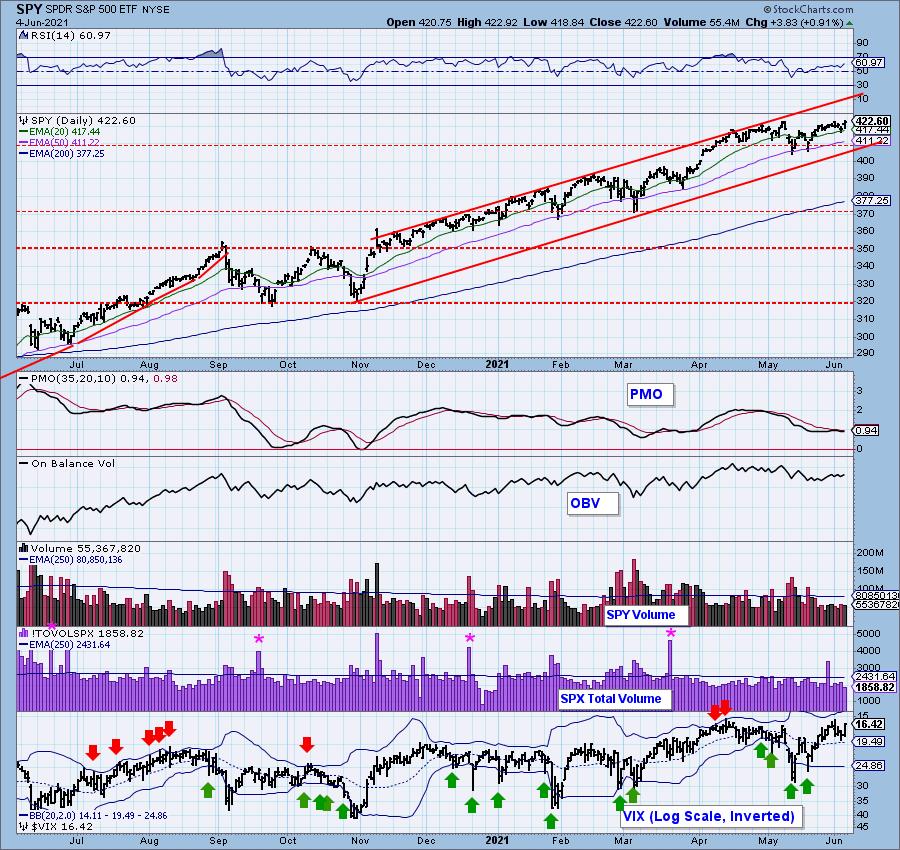
SPY Daily Chart: While SPY remained within the narrow trading range of the last two week, it closed on the day's high, which was a new, all-time high. The SPY rebounded off the 20-EMA and the confirmation line for the short-term double-bottom. The RSI is still positive and the PMO remained flat most of the week, topping briefly yesterday. The VIX rebounded off its EMA on the inverted scale which suggests there is some internal strength left.
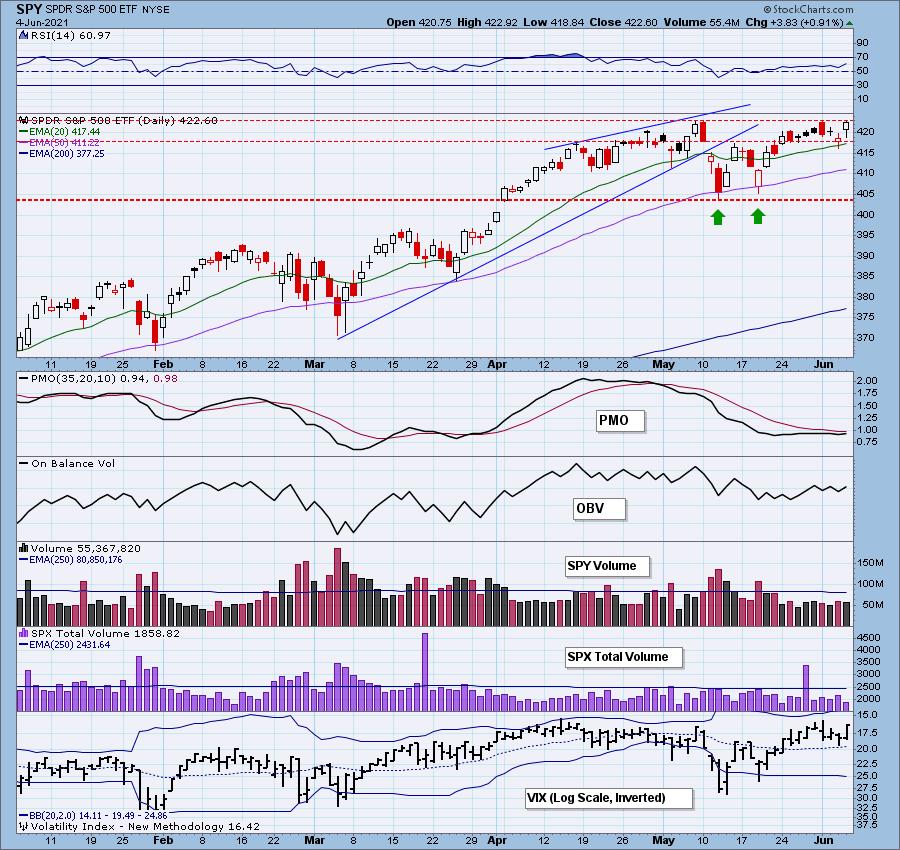
Total Volume didn't really confirm today's rally as it dropped even further below its annual average.

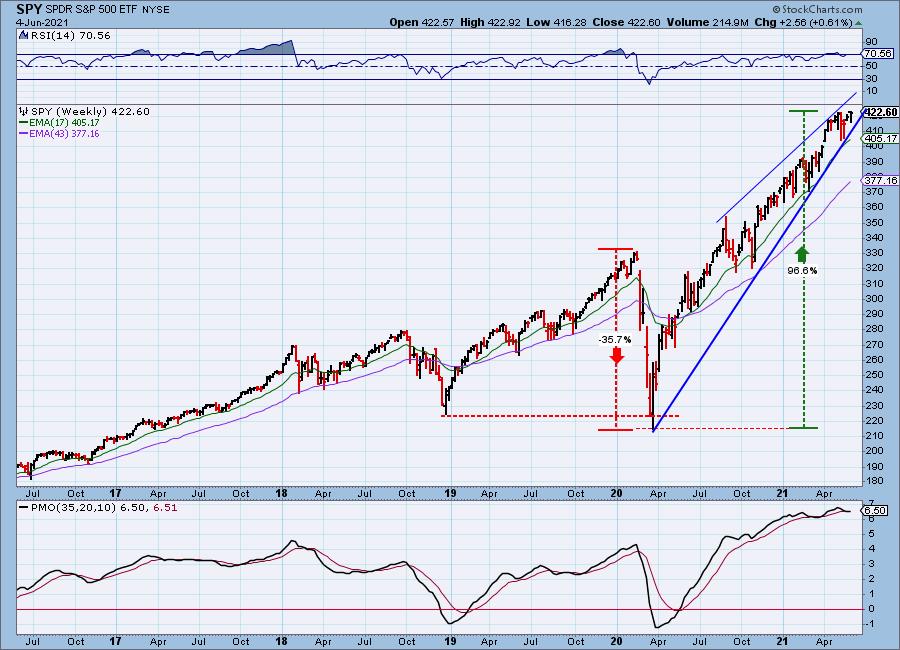
SPY Weekly Chart: There is a large rising wedge on this chart, which is bearish. Also bearish is the weekly PMO, which has topped and crossed down through the signal line -- not always bearishly prescient, but usually so.
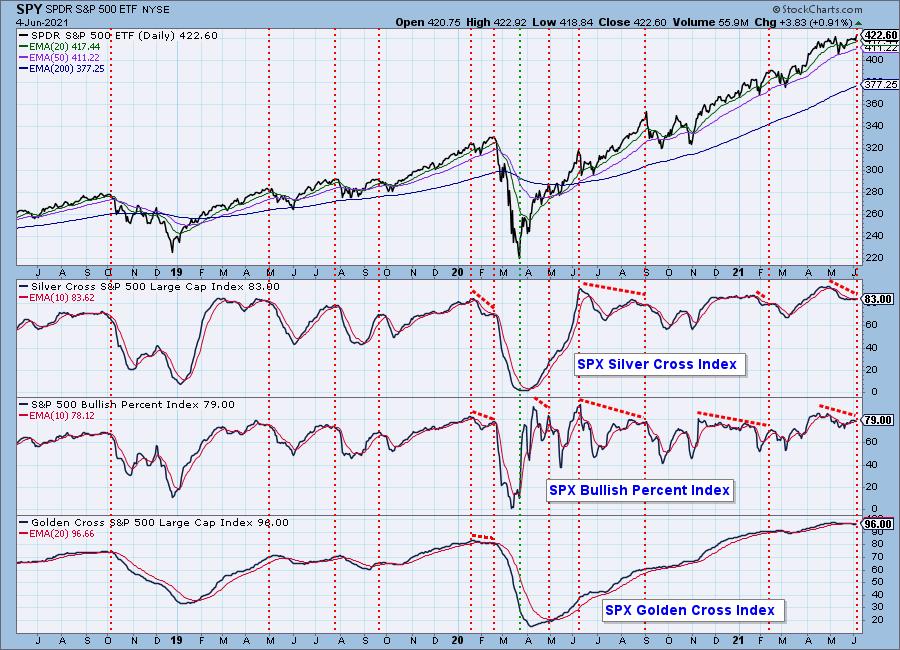
PARTICIPATION: The following chart uses different methodologies for objectively showing the depth and trend of participation for intermediate- and long-term time frames.
- The Silver Cross Index (SCI) shows the percentage of SPX stocks on IT Trend Model BUY signals (20-EMA > 50-EMA).
- The Golden Cross Index (GCI) shows the percentage of SPX stocks on LT Trend Model BUY signals (50-EMA > 200-EMA).
- The Bullish Percent Index (BPI) shows the percentage of SPX stocks on Point & Figure BUY signals.
The GCI had a negative crossover earlier in the week. As with the negative weekly PMO crossover SELL signal, you will generally see a pullback or correction after this occurs. However, we do note that we had a similar negative crossover in February and it came after the correction. This time we are coming out of the highest GCI reading in the history of this indicator (going back to 2017).
The BPI is technically in a rising trend, but did turn lower yesterday. The SCI topped below its signal line and is still inching lower.
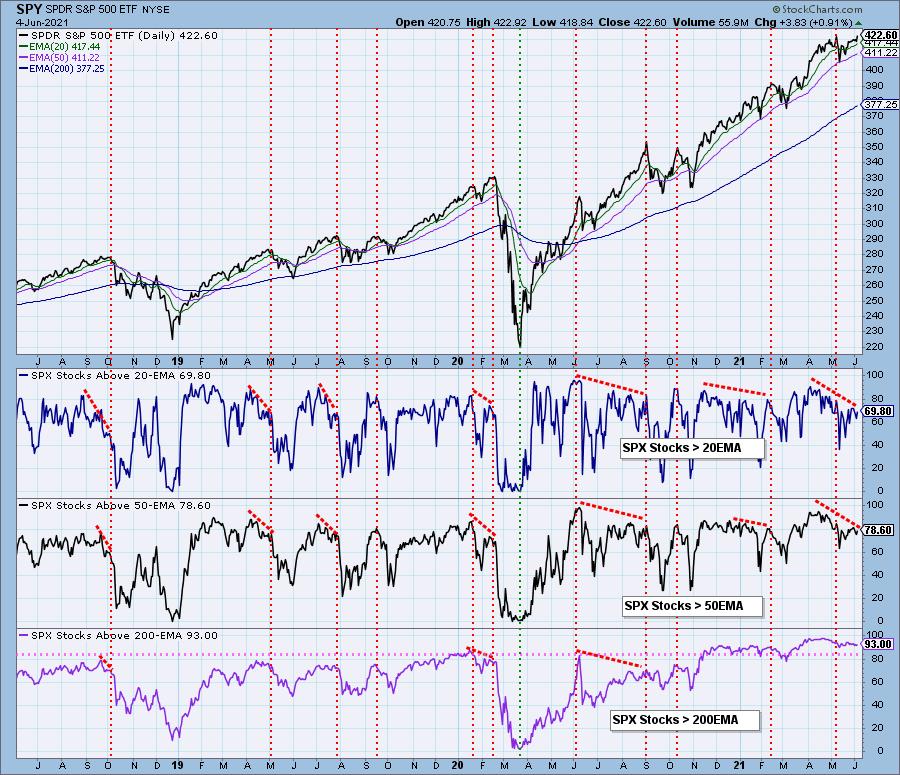
Participation in the short and intermediate terms is in a rising trend and readings aren't that overbought. The %Stocks > 200-EMA or the long-term component, is trending lower in extremely overbought territory.
Climax Analysis: We didn't see any climax days this week, today included. New Highs have been trending lower this week. As noted earlier, the VIX looks bullish.
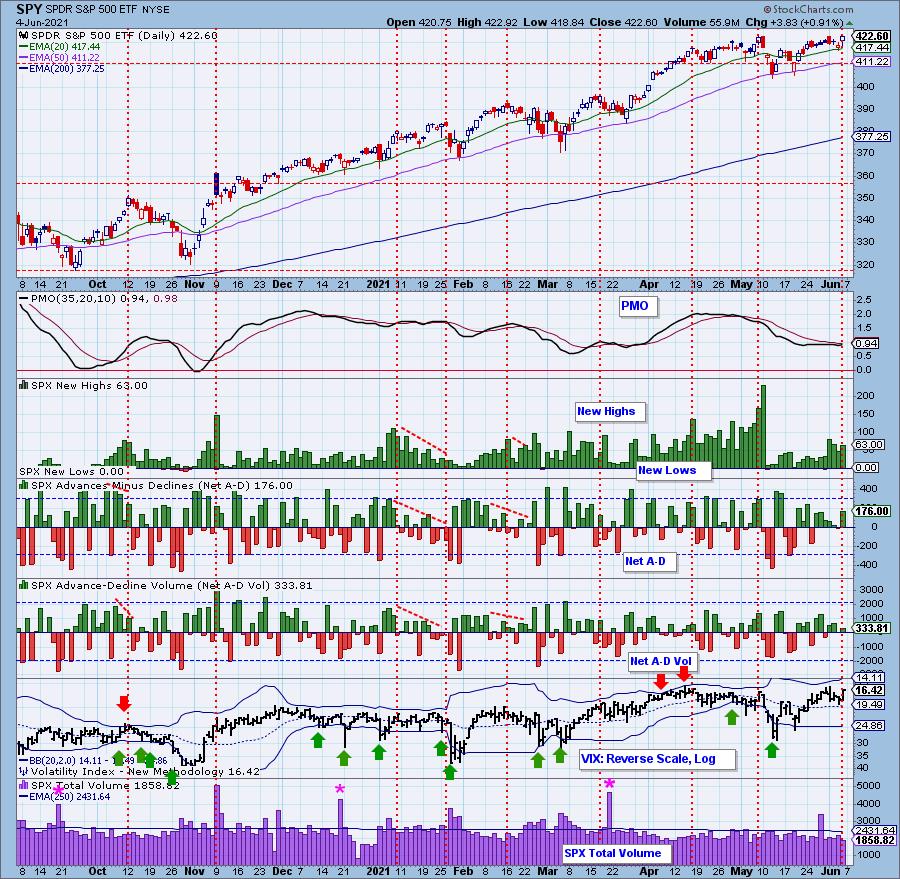
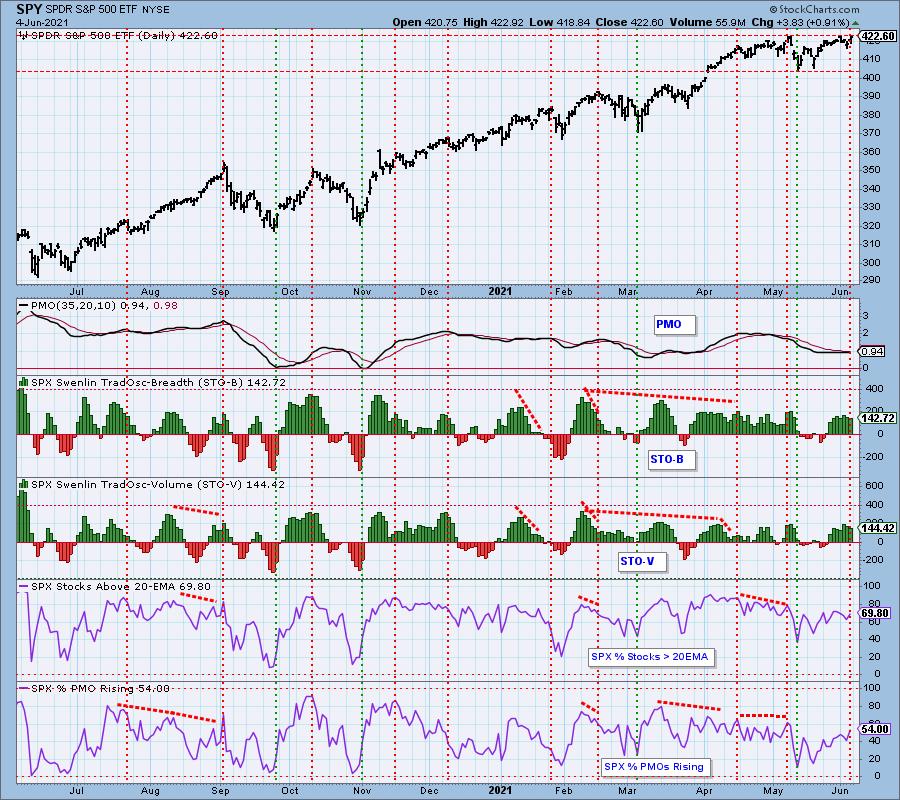
Short-Term Market Indicators: The short-term market trend is UP and the condition is SOMEWHAT OVERBOUGHT.
The STOs contracted again today which tells us to expect flat or declining prices early next week. However, the rising trend in %PMOs rising and a reading over 50% suggest it won't be especially damaging.
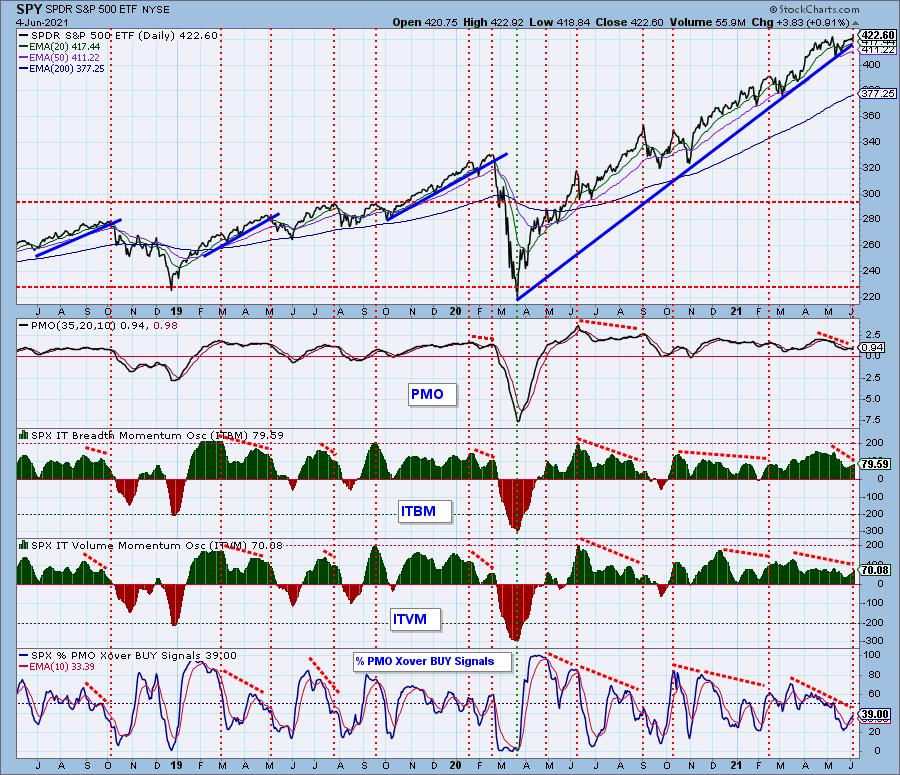
Intermediate-Term Market Indicators: The intermediate-term market trend is UP and the condition is SOMEWHAT OVERBOUGHT. The market bias is BULLISH.
The ITBM/ITVM continue to rise but are beginning to get overbought. %PMO BUY signals continues to improve and is far from overbought.
CONCLUSION: This week the short-term technical picture began to deteriorate. Today's rally was impressive in size, but not in terms of volume; additionally, it was accompanied by declining STOs. The biggest concerns are the SCI topping beneath its signal line and the GCI's negative crossover its signal line in overbought territory. While IT indicators are improving (ITBM/ITVM, %PMO BUY signals), the SCI and GCI are flashing "Warning, Will Robinson, warning!" Next week we should proceed with caution.
Have you subscribed the DecisionPoint Diamonds yet? DP does the work for you by providing handpicked stocks/ETFs from exclusive DP scans! Add it with a discount! Contact support@decisionpoint.com for more information!
BITCOIN
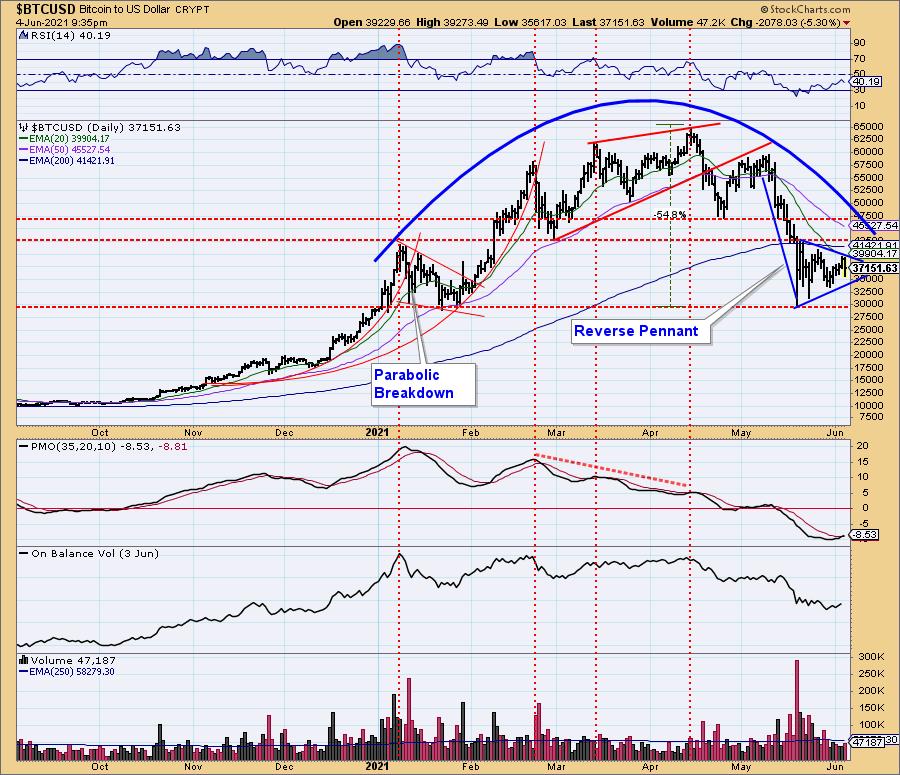
The dominant feature on this chart is a great rounded top formation. The next is a bearish reverse pennant formation. All of this points toward lower Bitcoin prices, potentially down to 10,000; however, let us not forget that some future context could dwarf the rounded top and obviate its significance. Case in point is the parabolic breakdown that we saw earlier this year. At the time, it was huge and significant. Now, in the context of subsequent price movement, not so much. Nevertheless, Bitcoin is in a bear market, and the technical signs tell us price will probably go lower. And experience tells us that a decline of about -50% is frequently enough to complete a bear market.
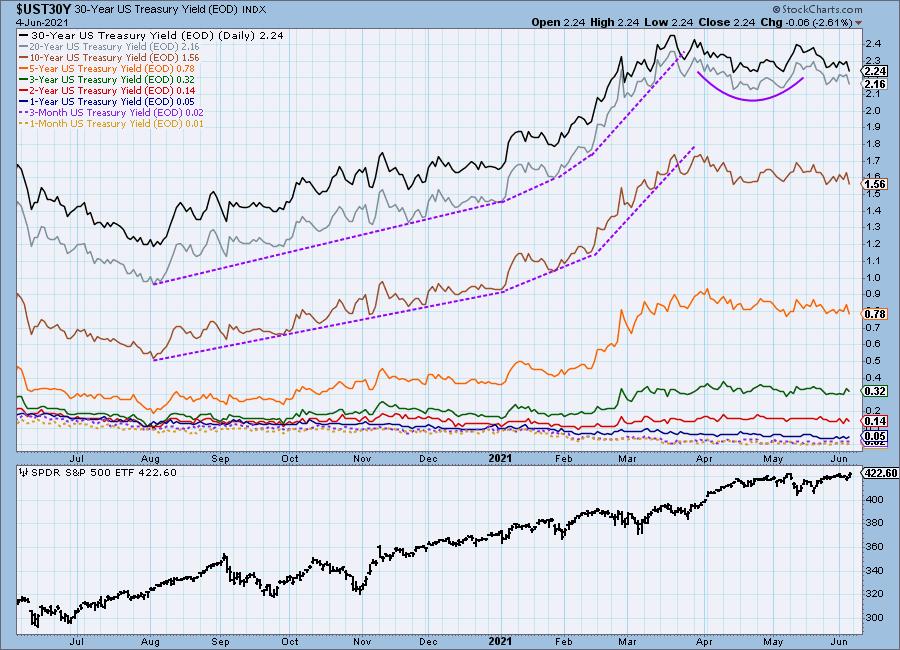
INTEREST RATES
Rates began to rebound this week, but finished much lower. Support is now being hit on the longer-term yields.
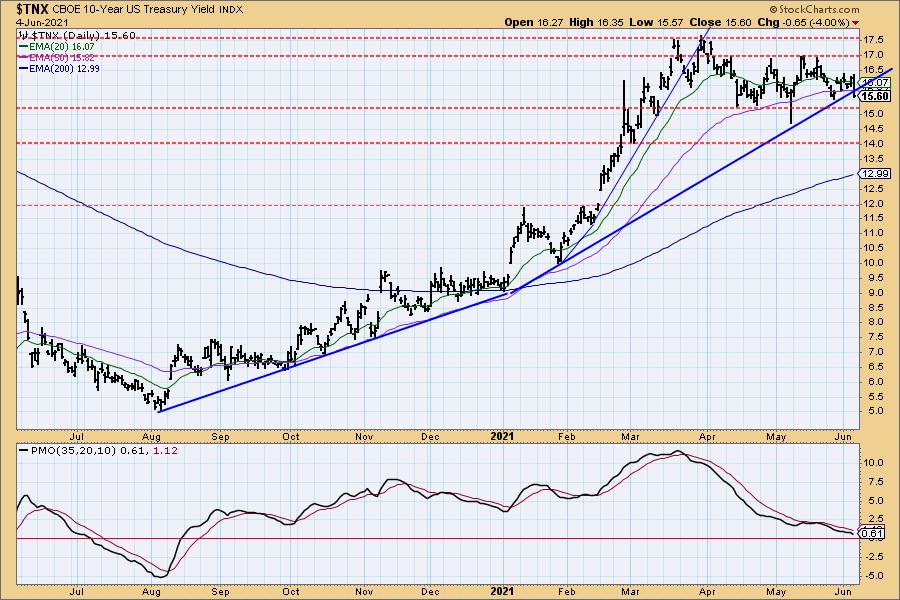
10-YEAR T-BOND YIELD
The long-term rising trend was broken today on $TNX. Losing the rising trend is significant, but price support hasn't been tested.
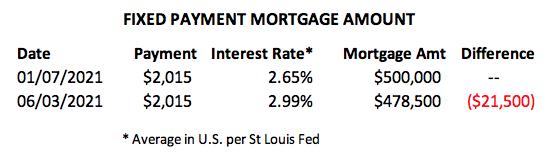
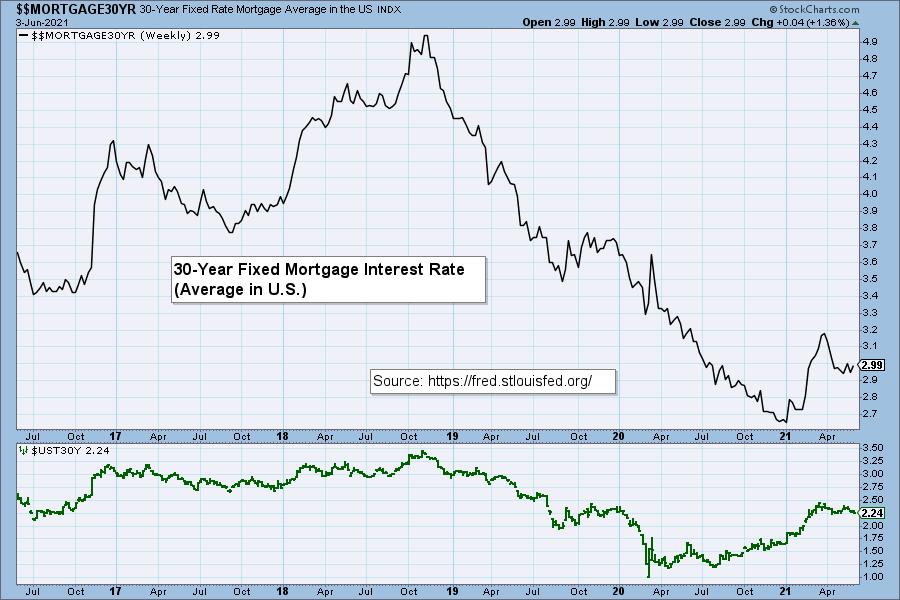
MORTGAGE INTEREST RATES (30-Yr)
We want to watch the 30-Year Fixed Mortgage Interest Rate, because, for the most part, people buy homes based upon the maximum monthly payment they can afford. As rates rise, a fixed monthly payment will carry a smaller mortgage amount. (See table.) As mortgages are forced to shrink, real estate prices will have to fall, and many sellers will increasingly find that they are upside down with their mortgage.
Rates have been dropping since the beginning of April, but they are beginning to reverse. Housing prices are moving up exponentially. My house has gained over 20% in value the past few months. That is parabolic. They end with a blood bath--swift, large and very painful declines.
DOLLAR (UUP)
IT Trend Model: SELL as of 4/26/2021
LT Trend Model: SELL as of 7/10/2020
UUP Daily Chart: The Dollar did begin to form a rising trend this week, but UUP overall is struggling to rally. Price simply cannot stay above the 20-EMA. The PMO suggests we will see this rally continue, but all of us know that the government is and will be printing money and the consequence will be a declining Dollar.
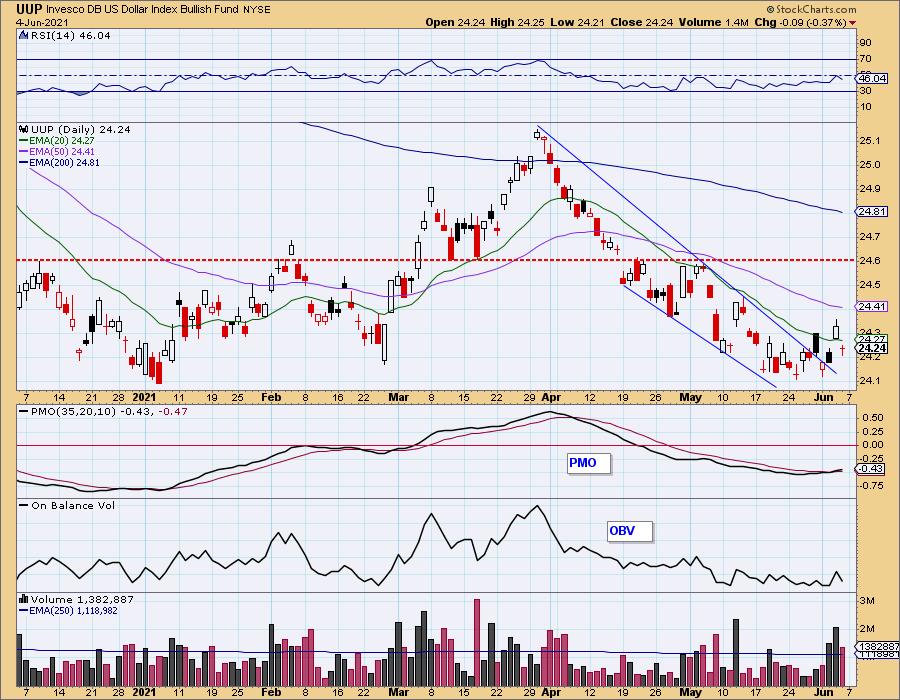
This support level is crucial for UUP to hold. It has managed to avoid losing this support level.
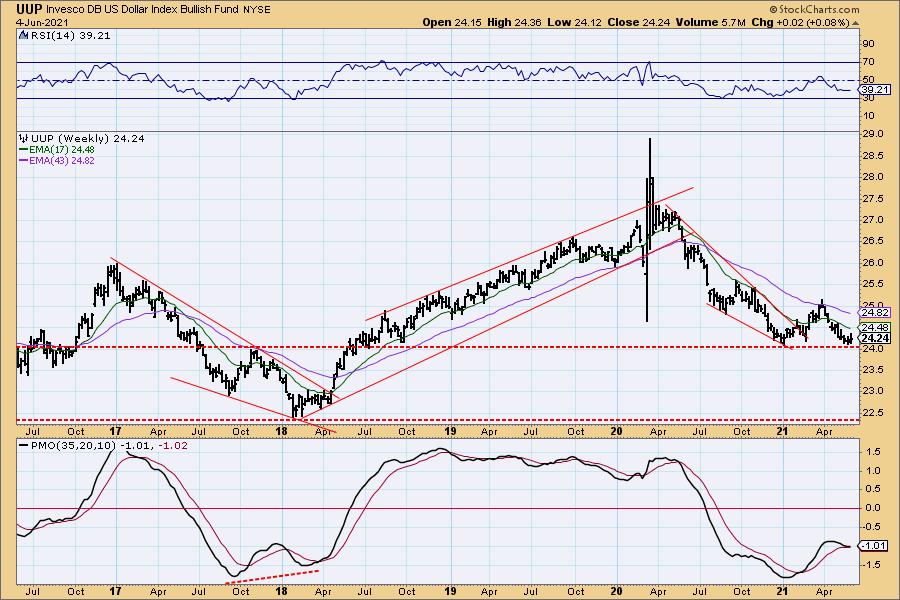
UUP Weekly Chart: UUP very nearly triggered an IT PMO SELL signal this week, but on the short-term rising trend established this week, the signal was avoided. We can see that this support level also matches up with the late 2017 top and the 2018 trough. If this level is lost, we should expect to see the Dollar (UUP) to move toward support at $22.50.
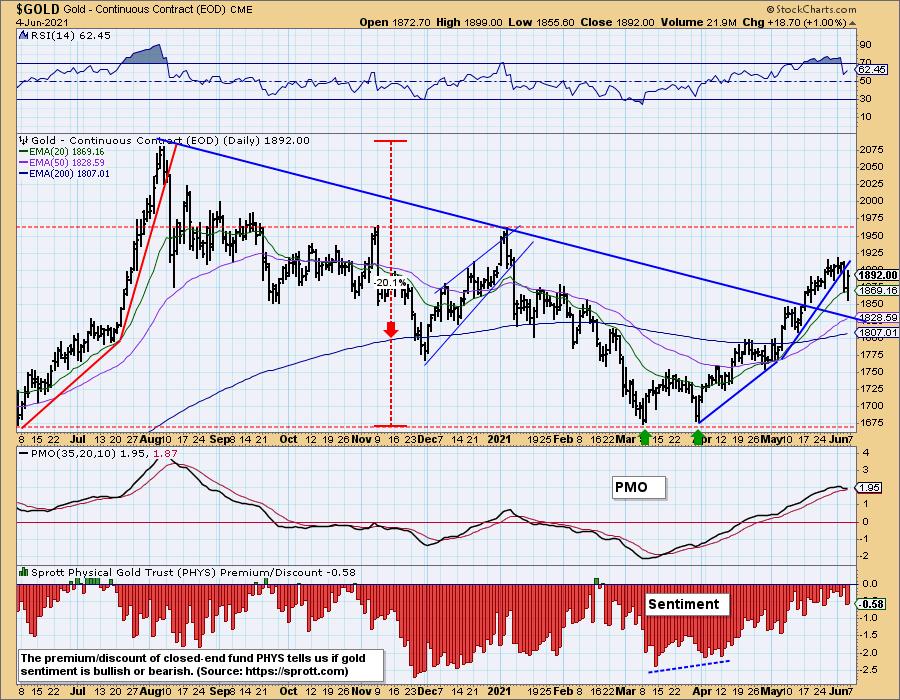
GOLD
IT Trend Model: BUY as of 5/3/2021
LT Trend Model: BUYas of 5/21/2021
GOLD Daily Chart: Gold rebounded after gapping down on the Dollar's strong rally yesterday. With the Dollar moving lower, Gold was able to rally, but hasn't recaptured the rising trend yet.
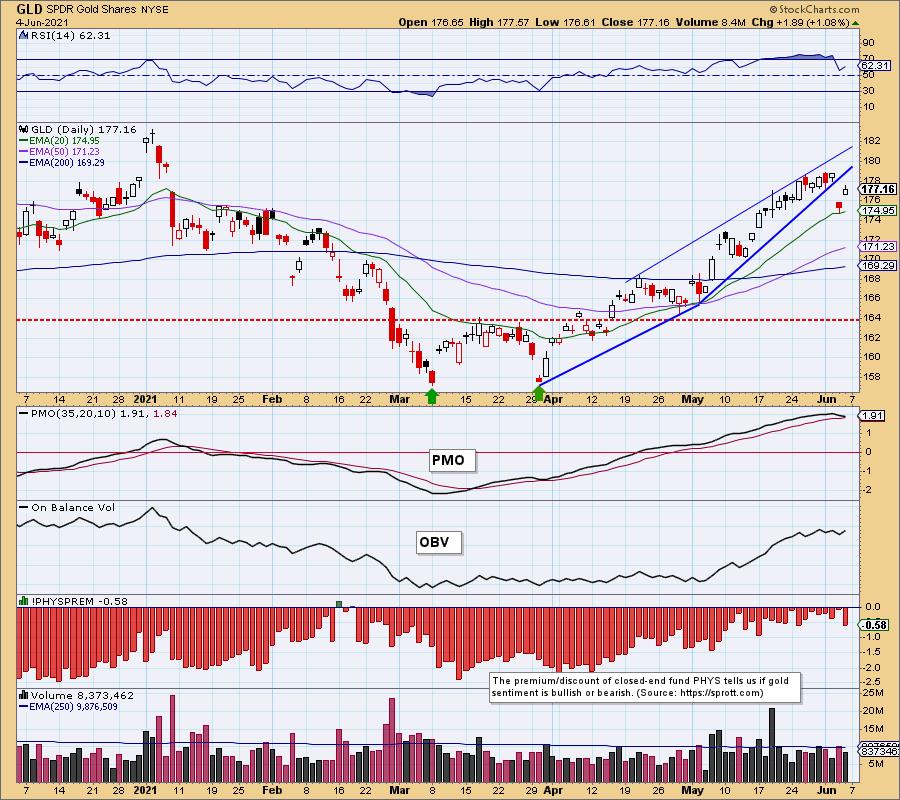
$GOLD dropped below the 20-EMA but managed to close higher. The PMO was lining up for a crossover SELL signal, but that has been avoided for now.
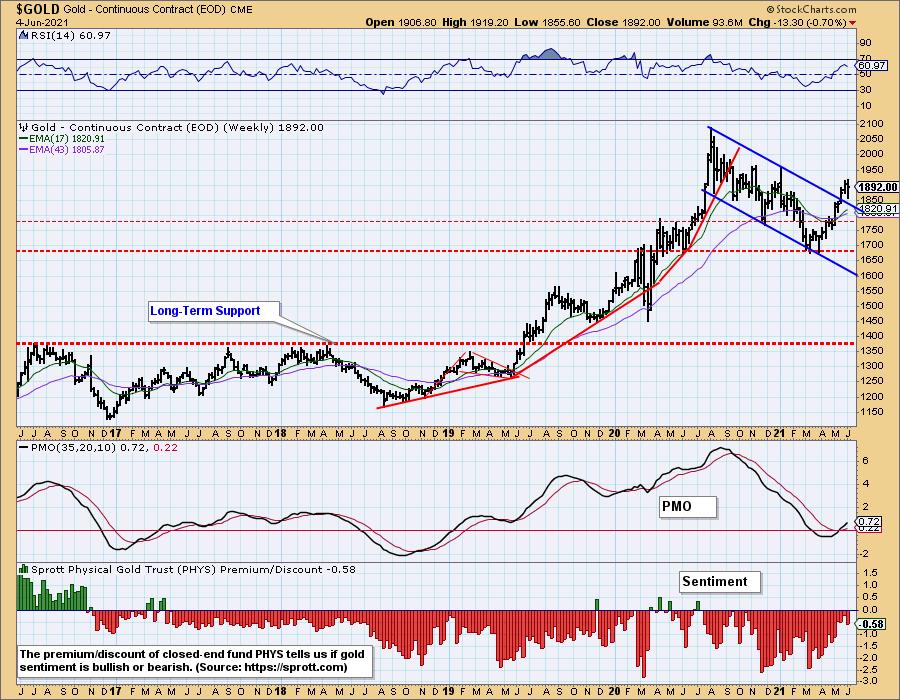
GOLD Weekly Chart: The weekly chart is very favorable for Gold. The weekly RSI is positive and the weekly PMO is rising on an oversold crossover BUY signal. Gold was overbought and it is time for it to digest the rally.
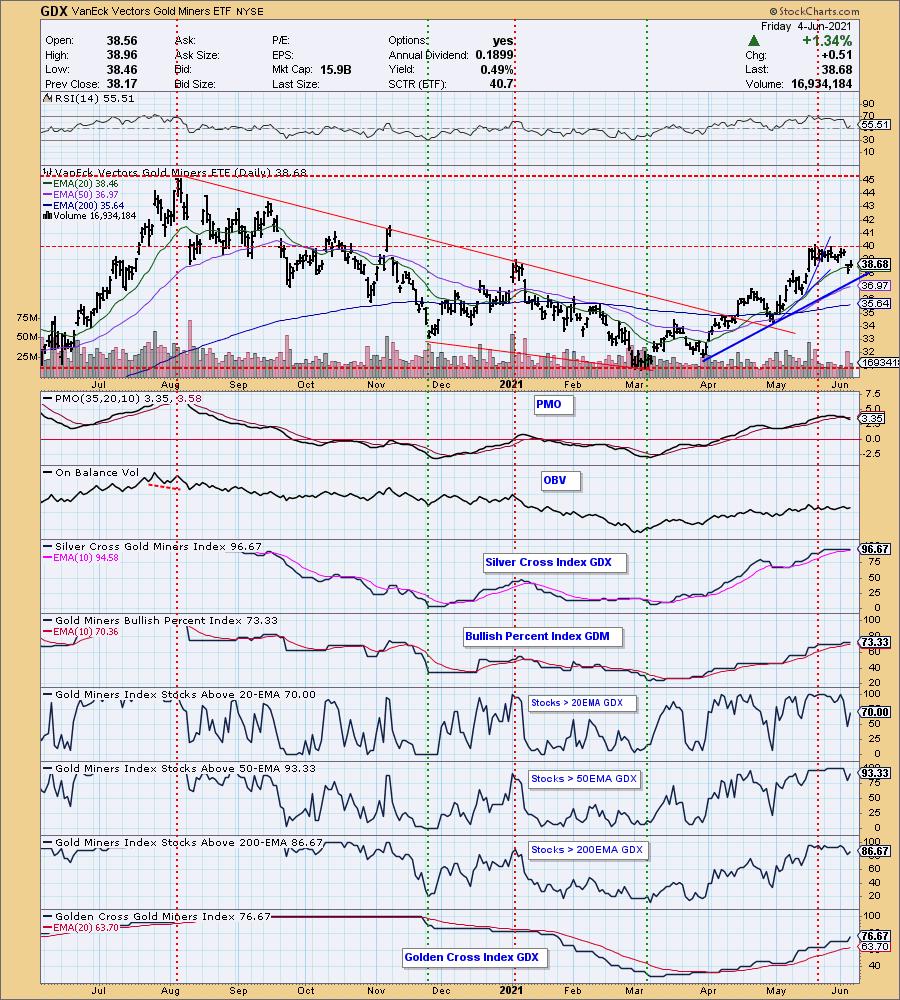
GOLD MINERS Golden and Silver Cross Indexes: After arcing increasingly upward from the March low, GDX began moving sideways in mid-May. Hope of a sideways correction was lost this week when it broke down. It is simply a case of price moving too far above the original rising trend line, and a good downside target would be where the rising trend line offers support.
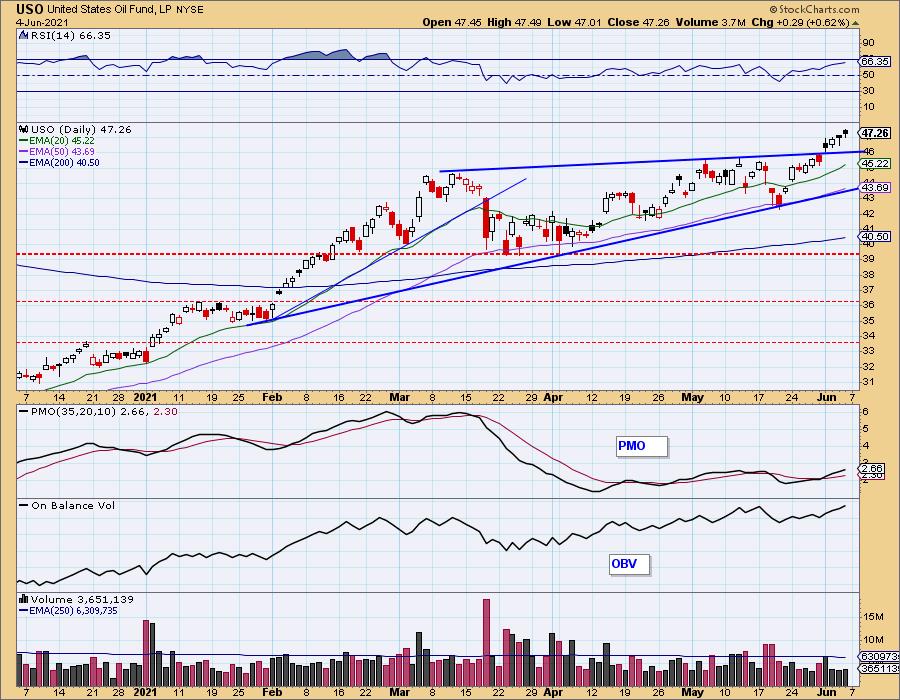
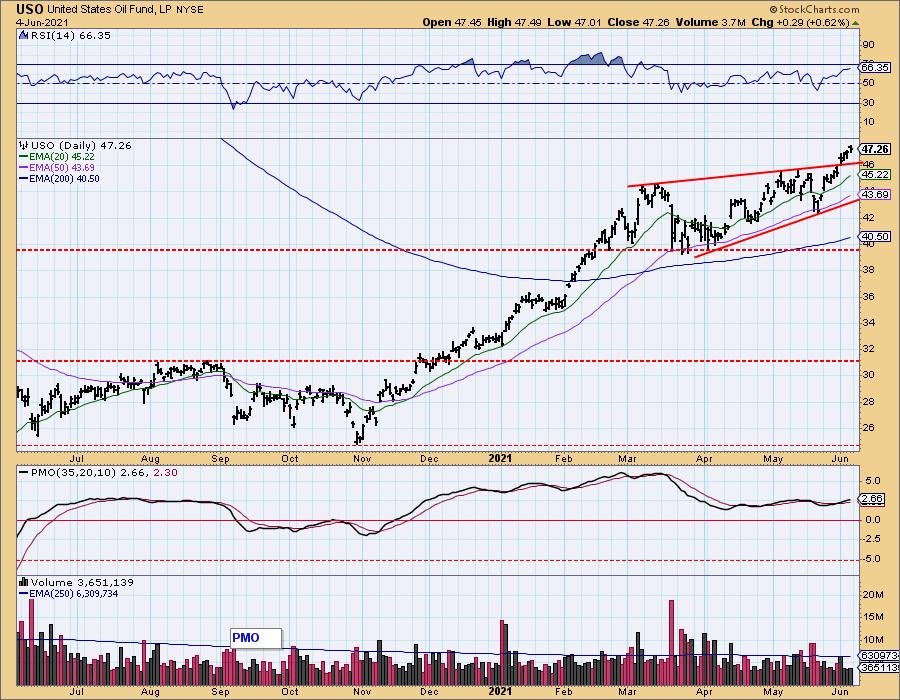
CRUDE OIL (USO)
IT Trend Model: BUY as of 11/23/2020
LT Trend Model: BUY as of 3/9/2021
USO Daily Chart: USO broke out this week and rallied strongly. The PMO is on a BUY signal and the RSI is positive. This breakout came out of a bearish rising wedge. A bullish conclusion to a bearish chart pattern is particularly bullish so we expect Crude Oil prices to continue higher.
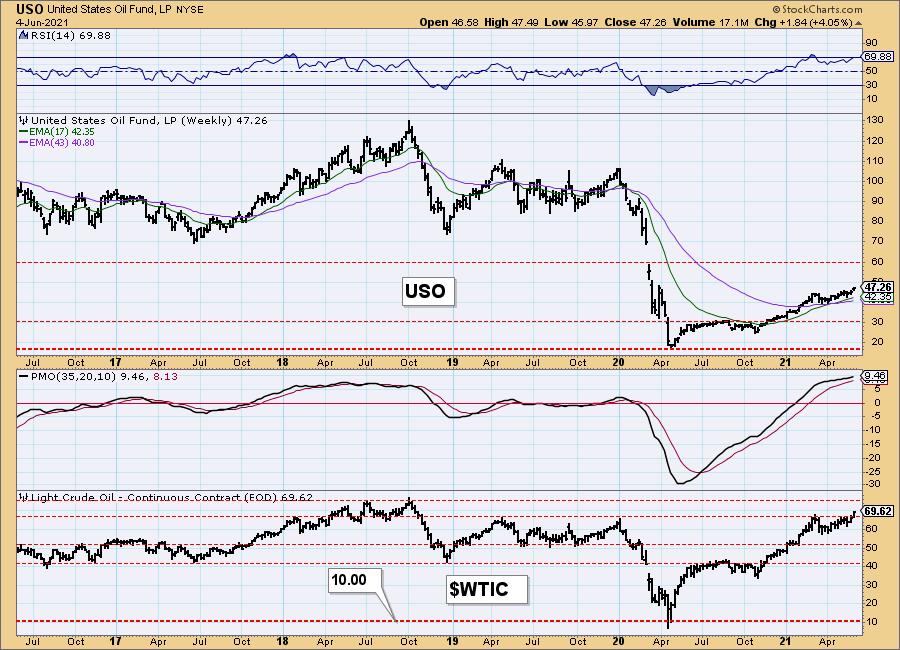
USO/$WTIC Weekly Chart: Overhead resistance on $WTIC was likely the reason we didn't see the breakout on USO sooner. The weekly PMO is rising, albeit somewhat overbought. The RSI is nearing overbought territory. Still, we expect to see USO eventually reach $60.
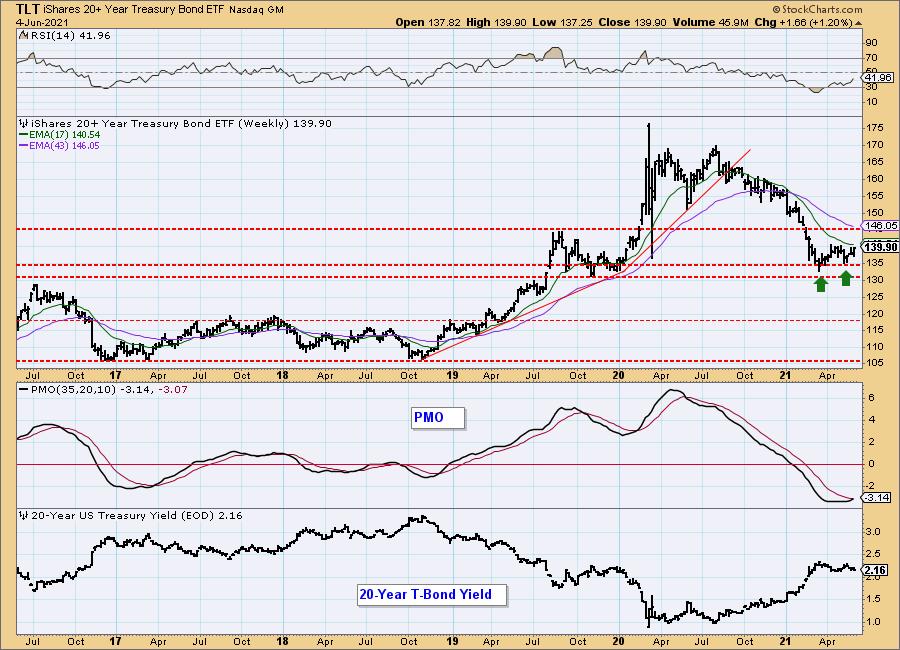
BONDS (TLT)
IT Trend Model: NEUTRAL as of 8/27/2020
LT Trend Model: SELL as of 1/8/2021
TLT Daily Chart: Rising yields have put pressure on TLT. Today's drop offered TLT a breakout opportunity. It did get back above the 50-EMA, but overhead resistance is nearing and this has been a failure point since the 50-EMA crossed below the 200-EMA.
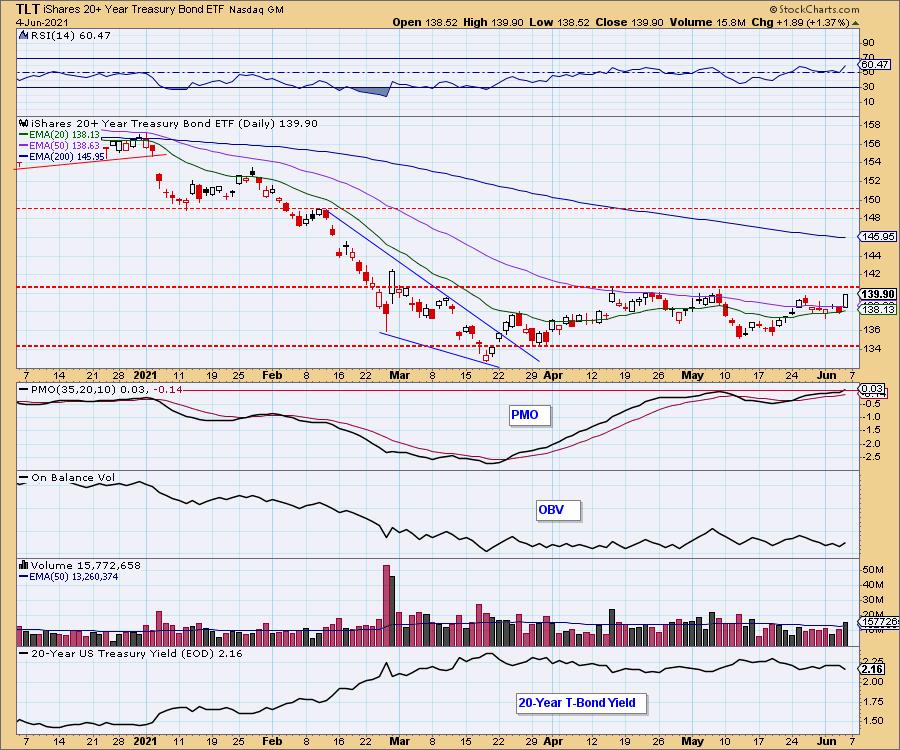
The PMO has now entered positive territory and is rising slightly. The RSI remained in positive territory despite the short-term declining trend. Yields are nearing support and TLT is nearing resistance. More than likely we will finally see TLT breakout. Today's deep decline in yields suggest they will not hold support which will put the wind at the back of long-term Bonds.
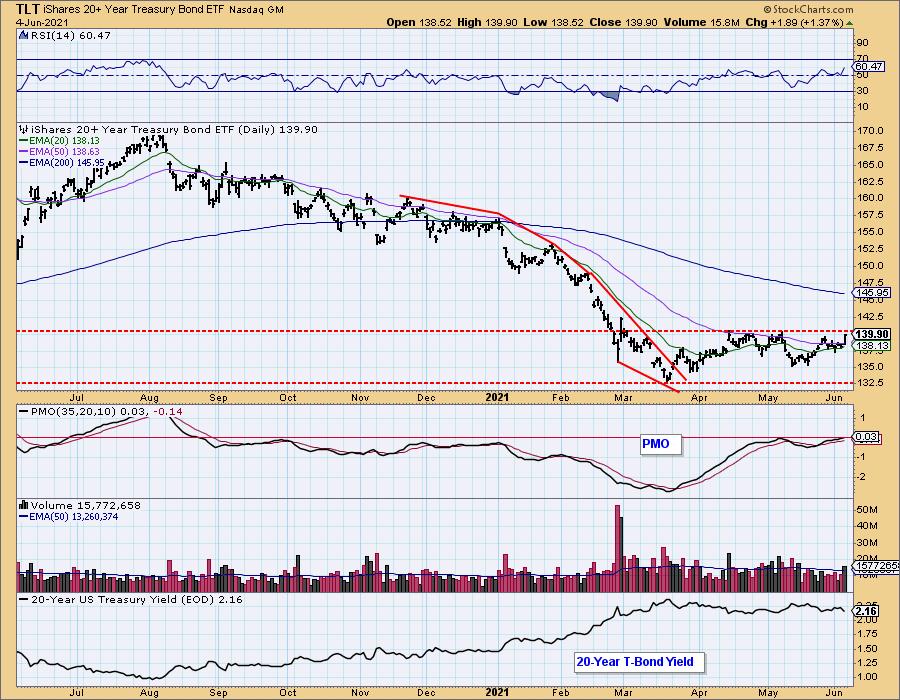
TLT Weekly Chart: The weekly chart also suggests we will see the breakout. There is a small bullish double-bottom on the weekly chart and the weekly PMO is nearing a crossover BUY signal. The weekly RSI is still weak, but it is rising.
Technical Analysis is a windsock, not a crystal ball.
-- Carl & Erin Swenlin
Disclaimer: This blog is for educational purposes only and should not be construed as financial advice. The ideas and strategies should never be used without first assessing your own personal and financial situation, or without consulting a financial professional. Any opinions expressed herein are solely those of the author, and do not in any way represent the views or opinions of any other person or entity.
NOTE: The signal status reported herein is based upon mechanical trading model signals, specifically, the DecisionPoint Trend Model. They define the implied bias of the price index based upon moving average relationships, but they do not necessarily call for a specific action. They are information flags that should prompt chart review. Further, they do not call for continuous buying or selling during the life of the signal. For example, a BUY signal will probably (but not necessarily) return the best results if action is taken soon after the signal is generated. Additional opportunities for buying may be found as price zigzags higher, but the trader must look for optimum entry points. Conversely, exit points to preserve gains (or minimize losses) may be evident before the model mechanically closes the signal.
Helpful DecisionPoint Links:
DecisionPoint Alert Chart List
DecisionPoint Golden Cross/Silver Cross Index Chart List
DecisionPoint Sector Chart List
Price Momentum Oscillator (PMO)
Swenlin Trading Oscillators (STO-B and STO-V)
DecisionPoint is not a registered investment advisor. Investment and trading decisions are solely your responsibility. DecisionPoint newsletters, blogs or website materials should NOT be interpreted as a recommendation or solicitation to buy or sell any security or to take any specific action.


