The normal P/E range for the S&P 500 is 10 (undervalued) to 20 (overvalued), but the P/E spike in 2009 nearly pushed that range into oblivion. The current P/E of 33.85 is the third highest in history, but it is the highest ever reached during a market advance. (The P/E peaks in 2002 and 2009 were reached after major market crashes.) There are two factors that can cause the P/E ratio to rise: (1) rising price and/or (2) falling earnings. Currently, prices and earnings are rising, but prices are rising much faster.
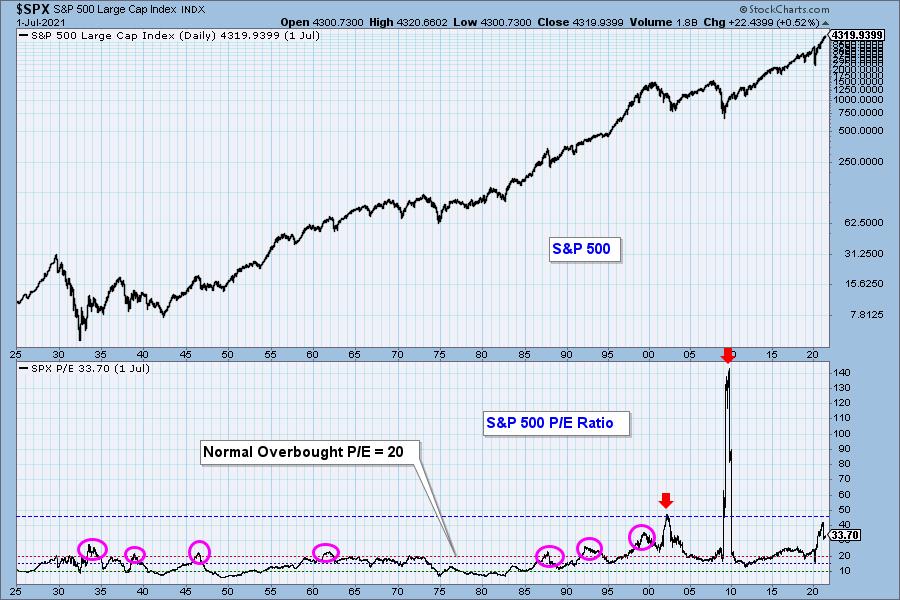
Overvalued means that people are paying too much for stocks based upon traditional valuation measures. The excess of overvalued markets can persist for years and is not a condition that requires immediate correction. Overvaluation is, however, a condition that can exacerbate declines because there is no intrinsic "value" present to incentivize potential buyers. Overvaluation doesn't matter . . . until it does.
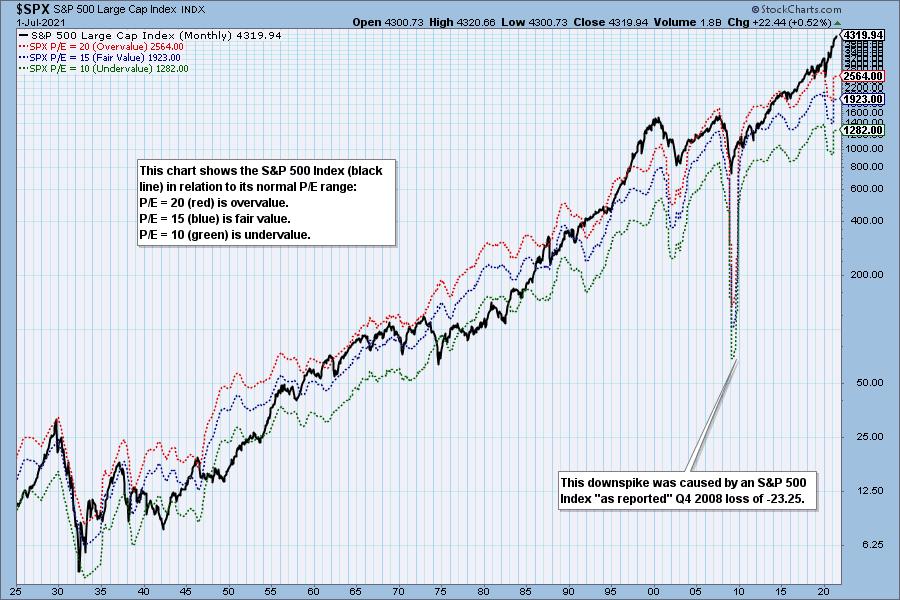
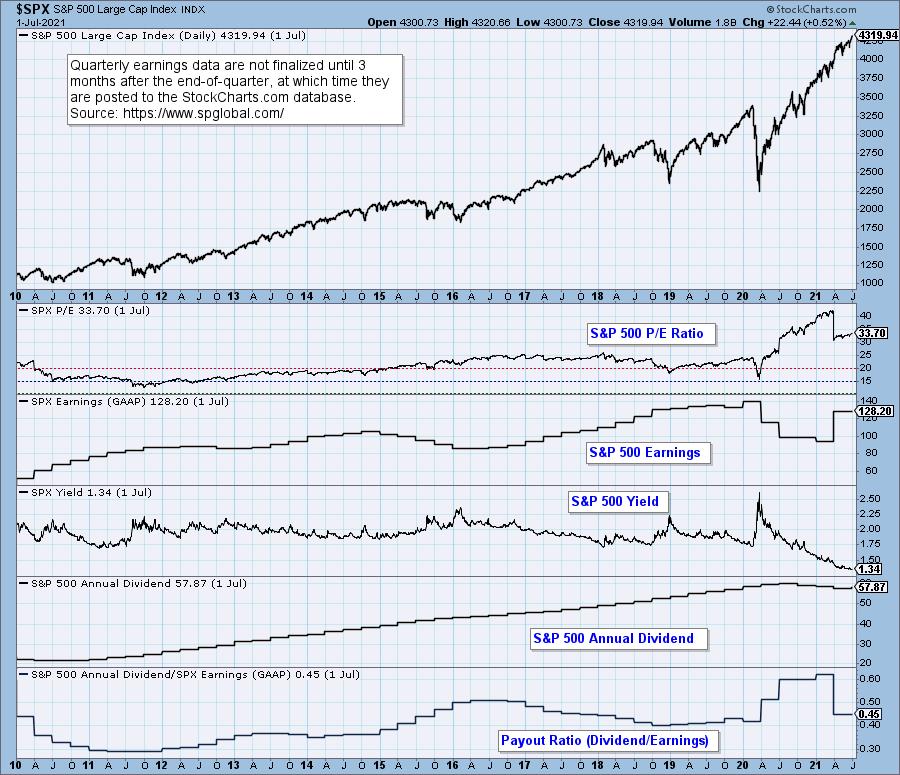
The following chart shows us the normal value range of the S&P 500 Index, indicating where the S&P 500 would have to be in order to have an overvalued P/E of 20 (red line), a fairly valued P/E of 15 (blue line), or an undervalued P/E of 10 (green line). Annotations on the right side of the chart show where the range is projected be based upon earnings estimates for the next four quarters, through 2022 Q1.
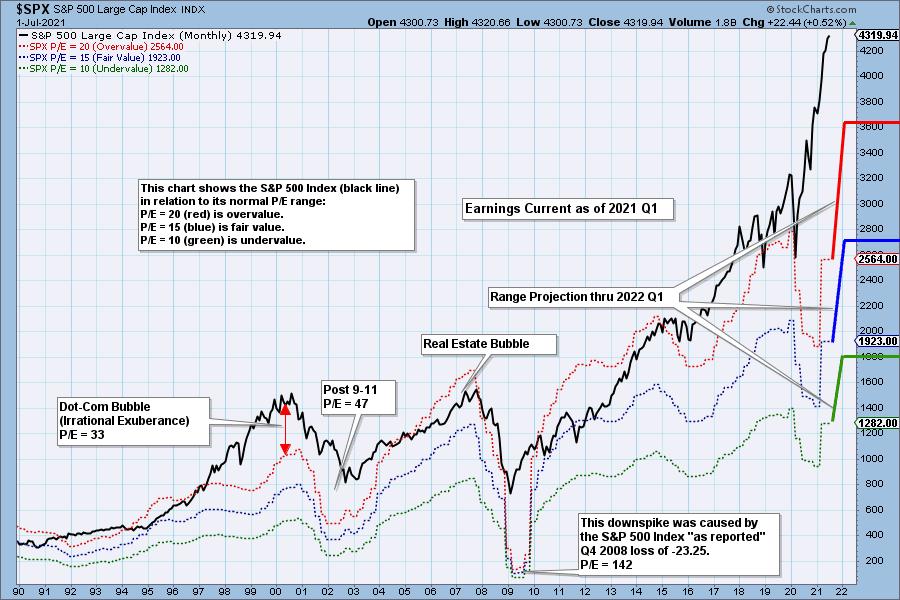
Historically, price has usually remained below the top of the normal value range (red line); however, since about 1998, it has not been uncommon for price to exceed normal overvalue levels, sometimes by a lot. The market has been mostly overvalued since 1992, and it has not been undervalued since 1984. We could say that this is the "new normal," except that it isn't normal by GAAP (Generally Accepted Accounting Principles) standards.
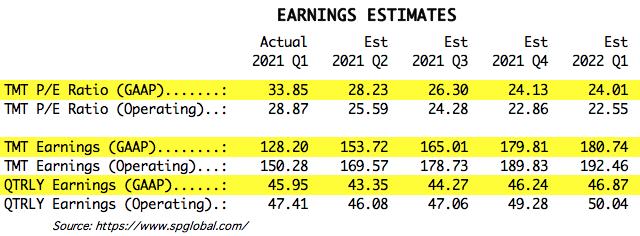
We use GAAP earnings as the basis for our analysis. The table below shows earnings projections through March 2022. Keep in mind that the P/E estimates are calculated based upon the S&P 500 close as of today. They will change daily depending on where the market goes from here.
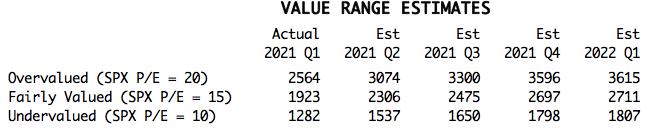
The following table shows where the colored bands will be, based upon earnings estimates through 2022 Q1. We can also see what the estimates were last quarter.
This DecisionPoint chart keeps track of S&P 500 fundamentals, P/E and yield, and it is updated daily -- not that you need to watch it that closely, but it is up-to-date when you need it.
CONCLUSION: This is the most overvalued market ever. While it doesn't require immediate correction, the amount of excess has got to be a major concern. But, who cares? Almost nobody.
(c) Copyright 2021 DecisionPoint.com
Technical Analysis is a windsock, not a crystal ball.
Helpful DecisionPoint Links:
DecisionPoint Alert Chart List
DecisionPoint Golden Cross/Silver Cross Index Chart List
DecisionPoint Sector Chart List
Price Momentum Oscillator (PMO)
Swenlin Trading Oscillators (STO-B and STO-V)


