When the 20-EMA crosses up through the 50-EMA, we consider it to be an intermediate-term BUY signal (aka Silver Cross, as opposed to the Golden Cross, to be discussed later). A few years ago, we developed the Silver Cross Index (SCI), which shows the percentage of stocks in a given index that have a Silver Cross status. It gives us a clear picture of the number of stocks that are participating in an advance or decline. The chart below shows the SCI for the three indexes that compose the S&P 1500 Index. It is not hard to see the severe negative divergences that exist on all three.
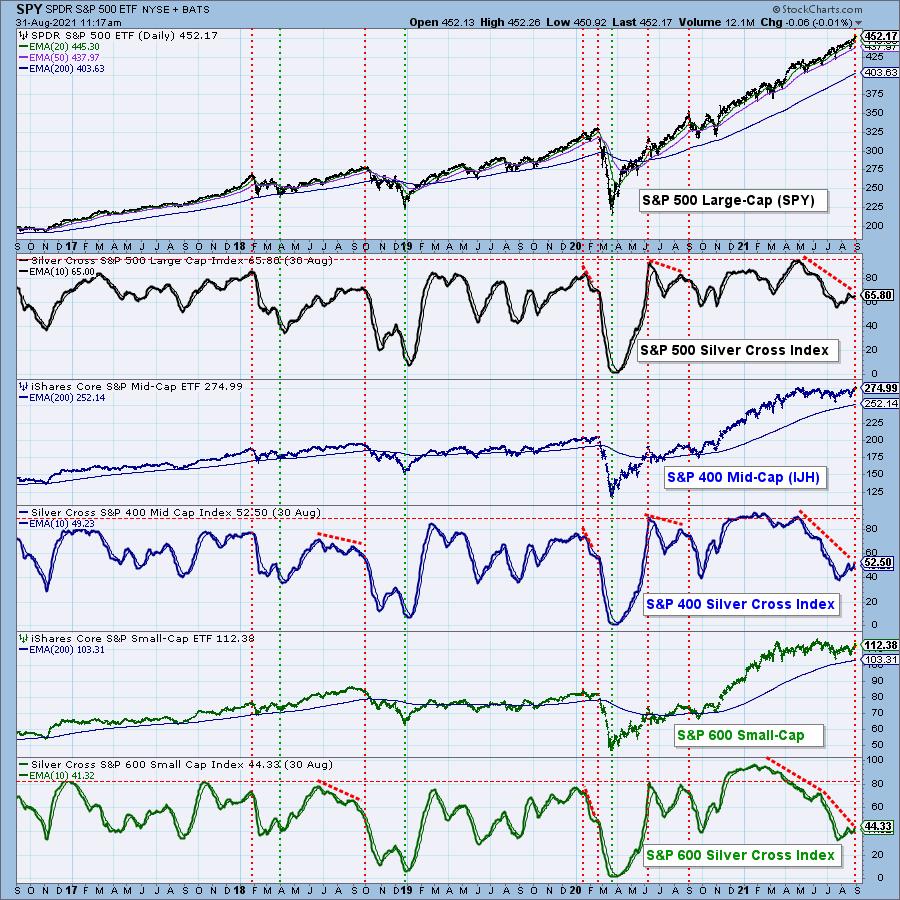
As we would expect, the S&P 600 has the lowest percentage of participation (44%) and has been flat for about six months. The S&P 400 has also been flat, but has a little better SCI reading of 53%. The large-cap S&P 500, still rallying after about 16 months, is strongest, with an SCI of 66%. Applying a little math, we determined that the SCI for the S&P 1500 is 53%. That's really poor and leaves the market vulnerable if current support dries up in the large-cap sector.

When the 50-EMA crosses up though the 200-EMA, it is widely considered to be a long-term BUY signal (aka Golden Cross). The Golden Cross Index (GCI) gives us a longer-term view of breadth and shows the percentage of stocks in an index that have Golden Cross status. While the GCIs for the three S&P 1500 indexes have pulled back somewhat, the pullbacks have been from record-high GCI levels and they still reflect strength in the longer term. The GCI for the S&P 1500 is 83%.
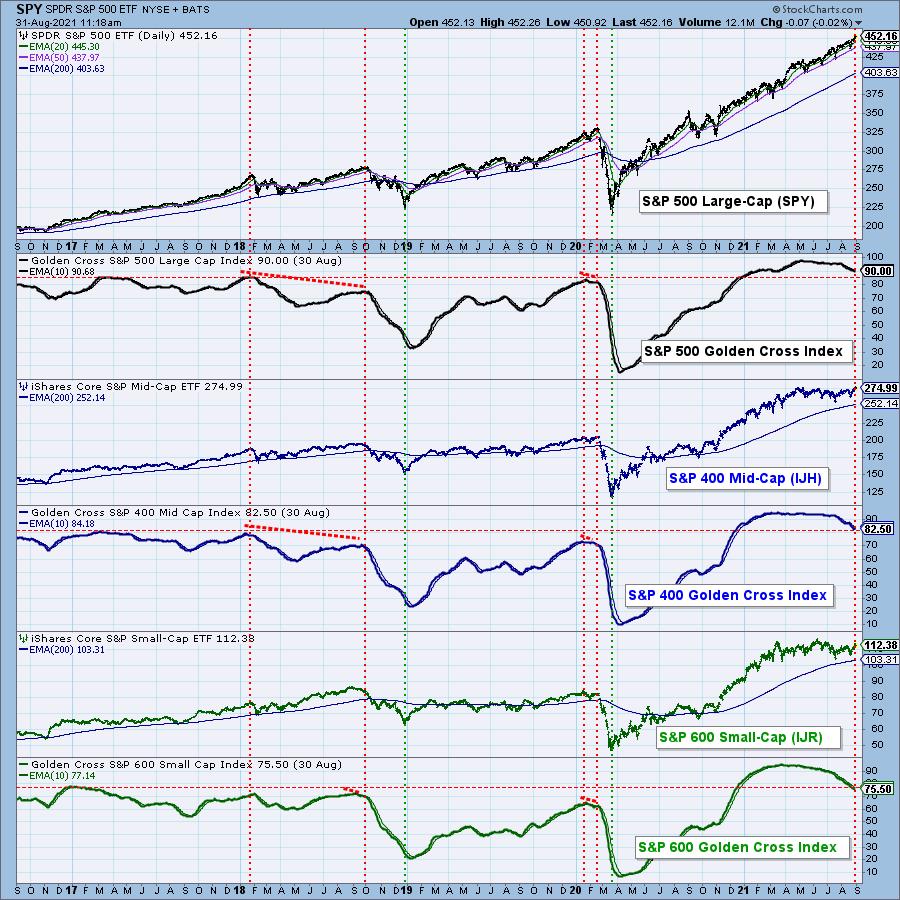
CONCLUSION: While the SCI shows considerable weakness in the intermediate-term, the GCI tells us that the long-term is fairly solid. We interpret this to mean that stocks without a Silver Cross Buy signal are simply languishing rather than completely falling apart. That's a good thing as far as it goes; however, with roughly half of S&P 1500 stocks in a swoon, there is really no cushion left to absorb the next bit of bad news.

Click here to register in advance for the recurring free DecisionPoint Trading Room! Recordings are available!
Technical Analysis is a windsock, not a crystal ball.
--Carl Swenlin
(c) Copyright 2021 DecisionPoint.com
Helpful DecisionPoint Links:
DecisionPoint Alert Chart List
DecisionPoint Golden Cross/Silver Cross Index Chart List
DecisionPoint Sector Chart List
Price Momentum Oscillator (PMO)
Swenlin Trading Oscillators (STO-B and STO-V)
DecisionPoint is not a registered investment advisor. Investment and trading decisions are solely your responsibility. DecisionPoint newsletters, blogs or website materials should NOT be interpreted as a recommendation or solicitation to buy or sell any security or to take any specific action.


