(This is a copy of last night's DecisionPoint Diamonds Report. I promised in today's Chartwise Women show that I would give some examples of how I set stops.)
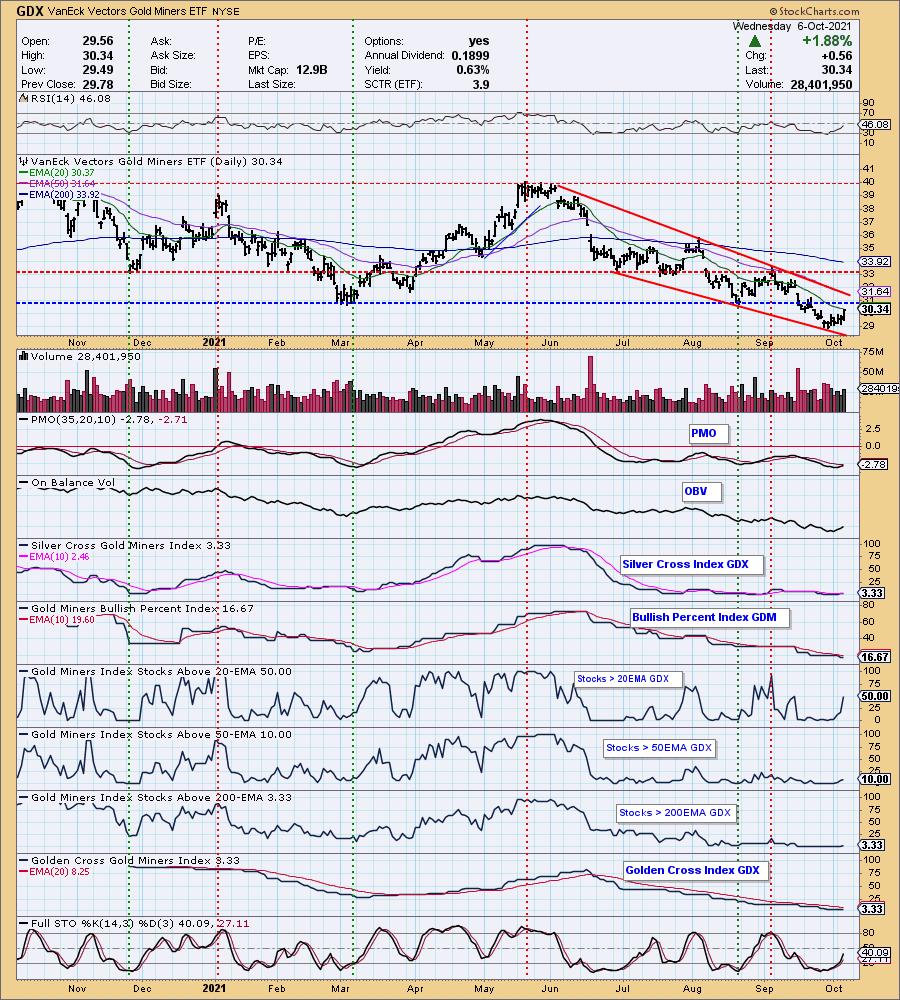
One of the charts that I review every market day in the DP Alert is the Gold Miners ETF (GDX). DecisionPoint.com has unique "under the hood" indicators that reveal participation in detail. Using %Stocks > 20/50/200-EMAs combined with our powerful Golden Cross/Silver Cross Indexes we are usually on top of when to consider entry and exit from this particular industry group. I wish we had this chart for more of the industry groups. For now we have it for all of the SPDR sectors and Gold Miners.
Below is the Gold Miners (GDX) chart. Yesterday I was cautiously bullish on Gold Miners as we had a bounce off the bottom of a bullish falling wedge. I was cautious because price had yet to break out and participation, while improving, was still somewhat weak. Well, I think we are finally looking at a good bottom here.
There is a strong bullish bias in the short term given the %Stocks > 20-EMA is above the SCI reading. We also see slight improvement in the intermediate term given %Stocks > 50-EMA is also above the SCI reading. We are now seeing a pulse. Other positive indications are the nearing PMO crossover BUY signal and the rising RSI that has nearly hit positive territory. Another very positive indicator is Stochastics. We see a nice thrust upward out of oversold territory.
Given the new found momentum on GDX, I thought it was time to present a few of the Gold Miners that popped up in my scan results. The charts are very bullish.
Reader Request Day tomorrow! Get your symbols in now! Click HERE.
Today's "Diamonds in the Rough": EGO, GFI and SSRM.

Register for our FREE DecisionPoint Trading Room held on Mondays at Noon ET.
Below is last Monday's Recording:
Topic: DecisionPoint Trading Room Recording
Start Time : Oct 4, 2021 09:00 AM
Meeting Recording LINK.
Access Passcode: October%4th
For best results, copy and paste the access code to avoid typos.
Welcome to DecisionPoint Daily Diamonds, wherein I highlight five "Diamonds in the Rough." These are selected from the results of my DecisionPoint scans, which search for stocks that could benefit from the trend and condition of the market. Remember, these are not recommendations to buy or sell, but are the most interesting of the stocks that surfaced in my scans. My objective is to save you the work of the initial, tedious culling process, but you need to apply your own analysis to see if these stocks pique your interest as well. There are no guaranteed winners here!
Eldorado Gold Corp. (EGO)
EARNINGS: 10/28/2021 (AMC)
Eldorado Gold Corp. engages in the mining, development and exploration of gold. It has mining operations, ongoing development projects and exploration in Turkey, Canada, Greece, Brazil, Romania and Serbia. The company was founded by Richard J. Barclay, Marco Antonio Romero, and Gary D. Nordin on April 2, 1992 and is headquartered in Vancouver, Canada.
Predefined Scans Triggered: P&F Descending Triple Bottom Breakdown, Three White Soldiers, Parabolic SAR Buy Signals, P&F Double Bottom Breakout and P&F Bearish Catapult.
EGO is unchanged in after hours trading. You'll note that all three of these charts are very similar to GDX, which of course makes sense. EGO has a bullish falling wedge. Price is testing the top of it. Most important, price closed well above the 20-EMA. The RSI moved into positive territory. The PMO triggered a crossover BUY signal. There is a positive divergence with the OBV. Stochastics are exactly what we want to see. Strong upthrust with a reading above net neutral (50). While the group may not be showing much in the way of relative strength, EGO outperforms both the group and the SPY. The stop level is pretty deep at -9.6%, but it needs to be below that support level.

The weekly chart looks a bit sketchy given the large rounded top formation. But we can see rising bottoms on the RSI as it travel higher. The PMO does appear to be decelerating in oversold territory. Price is bouncing off a strong support level.

Gold Fields Ltd. (GFI)
EARNINGS: 2/16/2022 (BMO)
Gold Fields Ltd. is a gold mining company, which engages in the production of gold and operation of mines. Its operating mines are located in Australia, Ghana, Peru, and South Africa. The company was founded on May 03, 1968 and is headquartered in Johannesburg, South Africa.
Predefined Scans Triggered: Elder Bar Turned Green, P&F High Pole and Rising Three Methods.
GFI is up +0.60% in after hours trading. Here we have another falling wedge. Price closed above the 20-EMA and is ready to break from the bullish wedge. The RSI just moved into positive territory and the PMO had a crossover BUY signal today. Those of you who watch the trading rooms, you know that this is a buy point on the 5-minute candlestick chart (PMO crossover and positive RSI). I like the set up. Stochastics just moved above net neutral. This is a strong performer within the Gold Mining industry group and it is already performing better than the SPY. The stop is less deep on this one at 8% which makes it slightly more attractive than EGO.

We don't have a large rounded top on the GFI weekly chart. We have a rising RSI. The PMO is still declining and just went below the zero line which isn't great. However, we are sitting at a very important support level. This looks like an excellent pivot point. Upside potential is very good at over 47%.

SSR Mining Inc. (SSRM)
EARNINGS: 11/11/2021 (BMO)
SSR Mining, Inc. is a gold company. It engages in the operation, development, exploration, and acquisition of metal resource properties located in Turkey and the Americas. The firm focuses on the Çöpler Gold Mine, Puna, Marigold Mines, and Seabee Gold Operations. The company was founded on December 11, 1946 is headquartered in Vancouver, Canada.
Predefined Scans Triggered: Elder Bar Turned Green, Bullish MACD Crossovers, P&F Triple Bottom Breakdown and P&F Double Bottom Breakout.
SSRM is down -0.79% in after hours trading. I think we could probably draw a falling wedge, but what is dominate about the price chart is the prior trading range. Price is now testing the bottom of that range. A breakout would be excellent. Price already broke above the 20-EMA today. The RSI is rising, but not quite positive yet. The PMO is arching up toward a crossover BUY signal. Stochastics are quite favorable. Relative strength shows us that this is generally an outperformer within the industry group. It's also beginning to outperform the SPY. I like this one as it has an even tighter stop level than the previous two at 6.6%.

Price hasn't quite tested support at the 2021 low. If it can sustain a rally and breakout here, that would be especially bullish because it didn't need to test that support level before bouncing. There is a positive divergence with the weekly OBV. Conservatively we are looking at a possible 24%+ gain.

Don't forget, on Thursdays I look at reader-requested symbols, so shoot me an email at erin@decisionpoint.com. I read every email I receive and try to answer them all!
Current Market Outlook:
Market Environment: It is important to consider the odds for success by assessing the market tides. The following chart uses different methodologies for objectively showing the depth and trend of participation for intermediate- and long-term time frames.
- The Silver Cross Index (SCI) shows the percentage of SPX stocks on IT Trend Model BUY signals (20-EMA > 50-EMA)
- The Golden Cross Index (GCI) shows the percentage of SPX stocks on LT Trend Model BUY signals (50-EMA > 200-EMA)
- The Bullish Percent Index (BPI) shows the percentage of SPX stocks on Point & Figure BUY signals.
Don't forget that as a "Diamonds" member, you have access to our GCI/SCI curated ChartList on DecisionPoint.com. You'll find it under "Members Only" links on the left side on the Blogs and Links Page.
Here is the current chart:

Full Disclosure: I'm about 70% invested and 30% is in 'cash', meaning in money markets and readily available to trade with. I will likely purchase one of these Gold Miners in the next day or two.
I'm required to disclose if I currently own a stock and if I may buy it within the next 72 hours.
Technical Analysis is a windsock, not a crystal ball.
Happy Charting!
- Erin
erin@decisionpoint.com
Watch the latest episode of DecisionPoint with Carl & Erin Swenlin on Mondays 7:00p EST or on the DecisionPoint playlist on the StockCharts TV YouTube channel here!

FREE TRIAL!
Subscribe to the Bundle Package and use coupon code: DPTRIAL and get one free week. You cancel at any time during your trial and still get the entire week for free!
NOTE: The stocks reported herein are from mechanical trading model scans that are based upon moving average relationships, momentum and volume. DecisionPoint analysis is then applied to get five selections from the scans. The selections given should prompt readers to do a chart review using their own analysis process. This letter is not a call for a specific action to buy, sell or short any of the stocks provided. There are NO sure things or guaranteed returns on the daily selection of "Diamonds in the Rough."
Helpful DecisionPoint Links:
DecisionPoint Shared ChartList and DecisionPoint Chart Gallery
Price Momentum Oscillator (PMO)
Swenlin Trading Oscillators (STO-B and STO-V)
For more links, go to DecisionPoint.com


