Lately I have been seeing many TV pundits predicting a market melt-up, so let's take a look at participation and see if there is a set-up compatible with that notion. Surely, the rally from the early-October lows is a good start on a melt-up, but the recent new highs have barely exceeded the September top. Is there any gas left in the tank? Our Golden Cross and Silver Cross Indexes give us a clear view of market participation and the potential for future price performance.
The Golden Cross Index (GCI) shows the percentage of S&P 500 stocks that have their 50EMA above their 200EMA, which gives a picture of long-term particiption. Since the GCI high earlier this year, it has dropped down to 82.4%. This leaves it in the overbought part of its range and still strong, and it has plenty of room to expand upward.
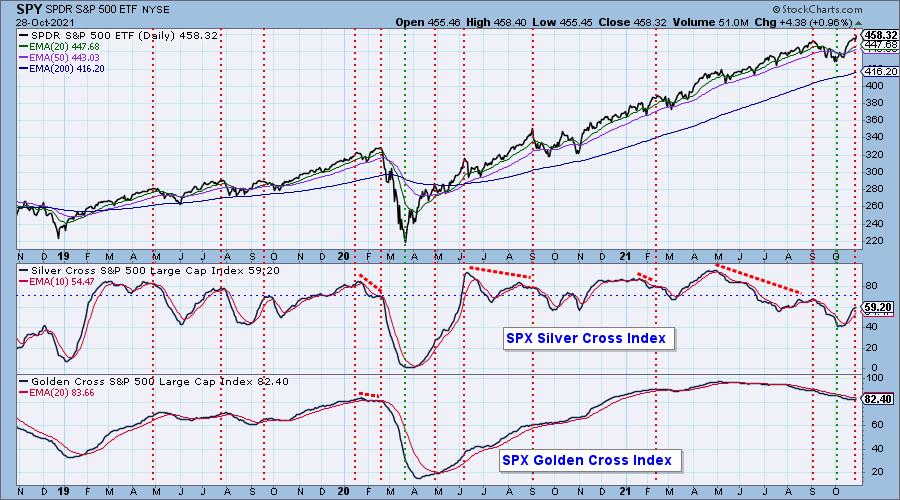

For the intermediate-term assessment we'll use the Silver Cross Index (SCI). It shows the percentage of stocks with their 20EMA above their 50EMA, and gives a compelling view of participation. The SCI deteriorated significantly since its April top, dropping from about 95% to 40% earlier this month -- 60% of stocks showing intermediate-term weakness! Frankly, I thought we were in real trouble at that point, but the October rally began and drove prices to all-time highs, and the SCI to back up to 59.2%. That is not spectacular participation, but it should be sufficient to support prices. More importantly, it is barely into the overbought range and has plenty of room to expand upward.
CONCLUSION: The SCI and GCI are a long way from where an overbought condition would interfere with the continuation of the rally. The potential for the rally to continue is also strong based upon the potential for seasonal pressures (Santa Claus rally). Whether it will be a "melt-up" remains to be seen, but internals should permit continued positive price action.

Click here to register in advance for the recurring free DecisionPoint Trading Room! Recordings are available!
Technical Analysis is a windsock, not a crystal ball.
--Carl Swenlin
(c) Copyright 2021 DecisionPoint.com
Helpful DecisionPoint Links:
DecisionPoint Alert Chart List
DecisionPoint Golden Cross/Silver Cross Index Chart List
DecisionPoint Sector Chart List
Price Momentum Oscillator (PMO)
Swenlin Trading Oscillators (STO-B and STO-V)
DecisionPoint is not a registered investment advisor. Investment and trading decisions are solely your responsibility. DecisionPoint newsletters, blogs or website materials should NOT be interpreted as a recommendation or solicitation to buy or sell any security or to take any specific action.


