Here is part of the opening paragraph from yesterday's subscriber-only DP Diamonds Report:
"I am still not in favor of expanding exposure. Big reason would be the diminishing participation within the major indexes. It's going to get harder and harder to find solid winners as there are fewer and fewer to pick from."
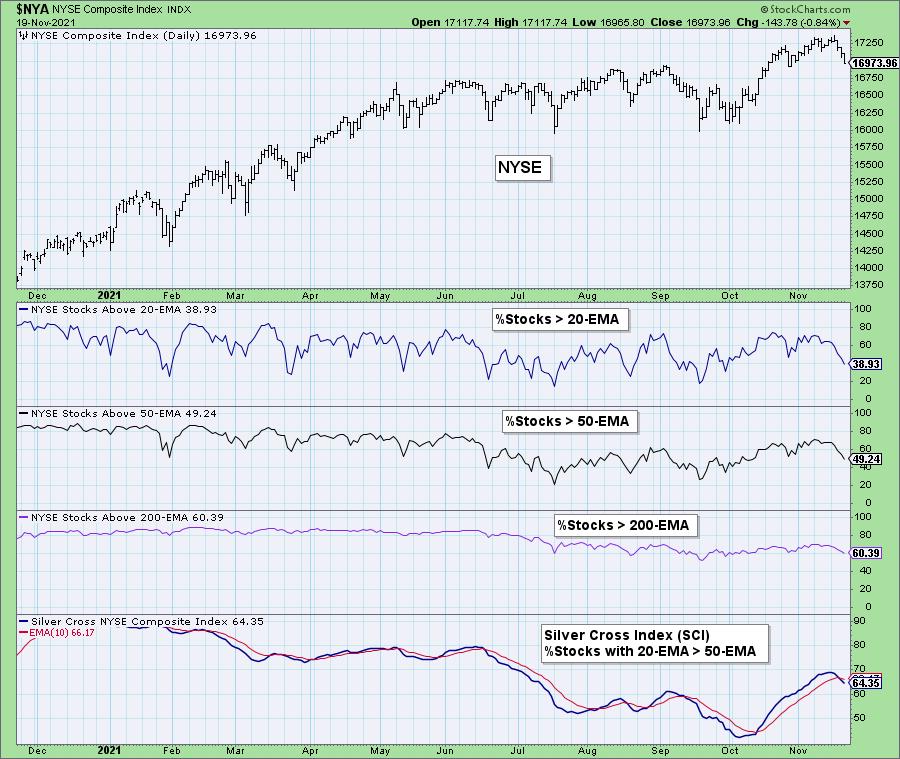
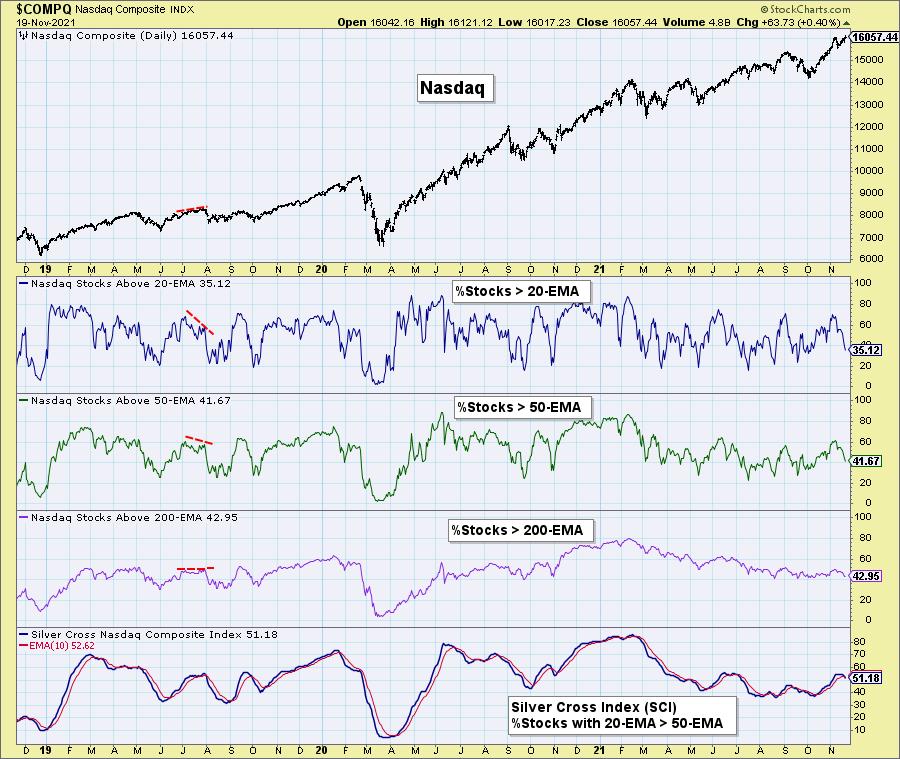
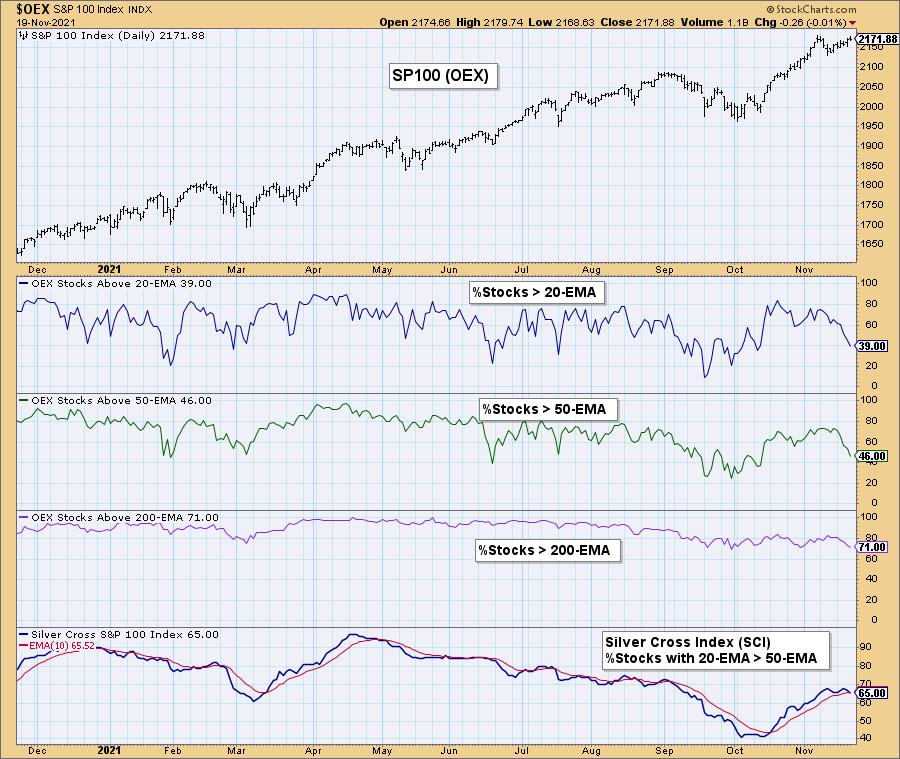
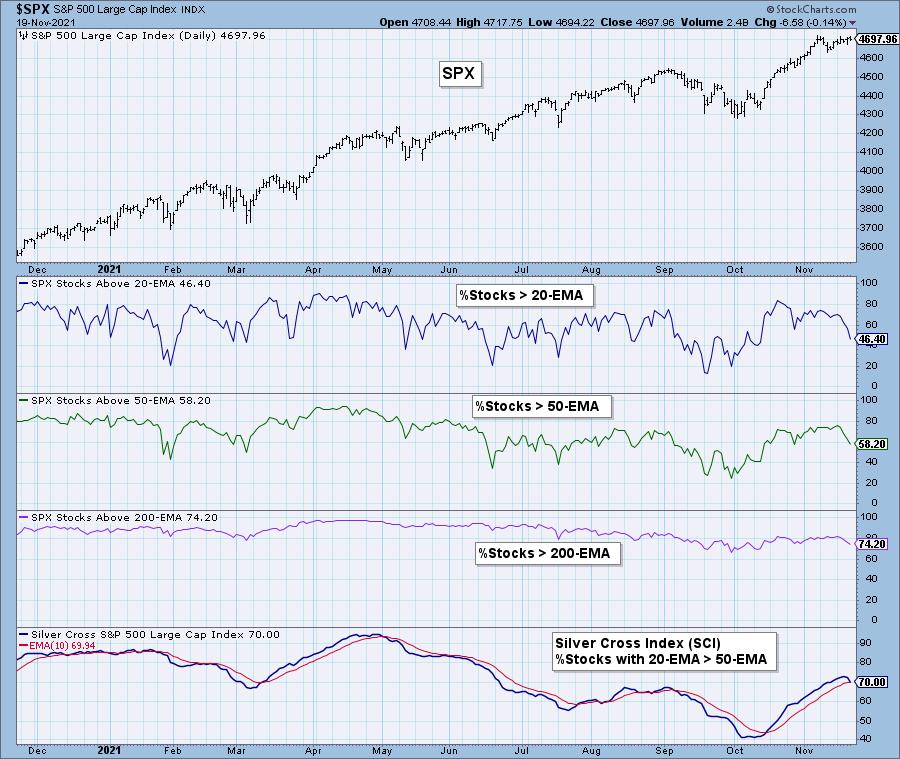
Below are the visuals behind that statement. I've included the participation charts for the NYSE, Nasdaq, OEX and SPX below. It shows you the %Stocks > 20/50/200-EMAs. I've also included the Silver Cross Index (SCI). The SCI is a breadth indicator that measures the percentage of stocks that have their 20-EMA > 50-EMA.
When the %Stocks > 20/50-EMAs is less than the SCI percentage, there is a bearish short-term bias. You'll note all of these indexes have short-term bearish biases moving into next week.
The NYSE, Nasdaq and OEX have less than 40% of their stocks with price > 20-EMA and these numbers are getting worse each day. The SCIs on all four of these indexes had negative crossovers their signal lines this week.
The NYSE has a differential between %Stocks > 50-EMA and the SCI of 29%. The SCI will likely accelerate its decline next week. Remember that EMAs move toward price. If price is above, they move higher. If price is below, they move lower. You cannot get an improved reading on the SCI when fewer stocks are above their 20/50-EMAs.


Click here to register in advance for the recurring free DecisionPoint Trading Room! Recordings are available!
The Nasdaq has the weakest participation of the bunch with %Stocks > 20-EMA at a mere 35%.
The OEX shows participation free falling lower.
The SPX is the only index with %Stocks > 20-EMA sitting above 40% and that is still very weak.
Conclusion: I had been looking for sideways consolidation and then a resumption of the rally this past week. The first part played out with consolidation and a trickle up this week. However, given the speedy contraction of participation among the major market indexes, I expect next week will not see new all-time highs, but a pullback on prices instead.
Technical Analysis is a windsock, not a crystal ball.
--Erin Swenlin
(c) Copyright 2021 DecisionPoint.com
Helpful DecisionPoint Links:
DecisionPoint Alert Chart List
DecisionPoint Golden Cross/Silver Cross Index Chart List
DecisionPoint Sector Chart List
Price Momentum Oscillator (PMO)
Swenlin Trading Oscillators (STO-B and STO-V)
DecisionPoint is not a registered investment advisor. Investment and trading decisions are solely your responsibility. DecisionPoint newsletters, blogs or website materials should NOT be interpreted as a recommendation or solicitation to buy or sell any security or to take any specific action.


