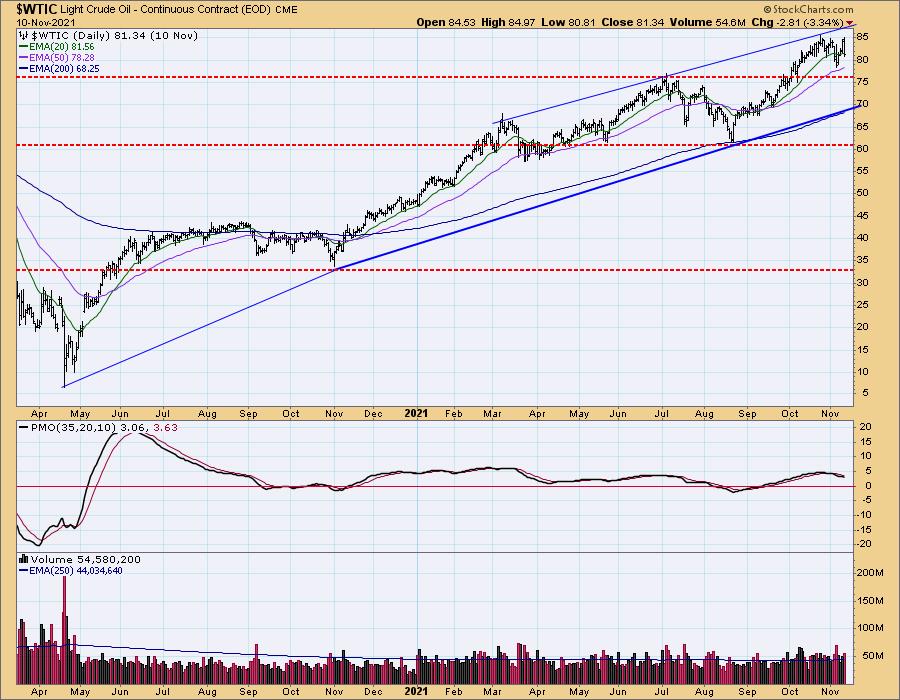
Earlier this week I filled my gas tank at a cost of $4.65 per gallon, up $0.25 from the last fill-up. That's the way it is in Redlands, California, and it got me to wondering how high prices might go. That, of course, depends mostly upon crude oil prices. Let's look at WTIC (West Texas Intermediate Crude). From the pandemic low of 6.50/bbl it has advanced to 85.00/bbl, so it is certainly moving higher at a rapid pace; however, this time frame is too short to project future upside potential.

Normally, I would move to a weekly chart, but the monthly chart covering almost 40 years presents a much better perspective. First, we see the 'good old days' of the 1980s and 1990s with a relatively quiet range of 10/bbl to 40/bbl, but forget that. The 2000s gave us a parabolic advance up to over 147/bbl, then a crash back down to about 35/bbl, which I think will represent the bottom of the range going forward.
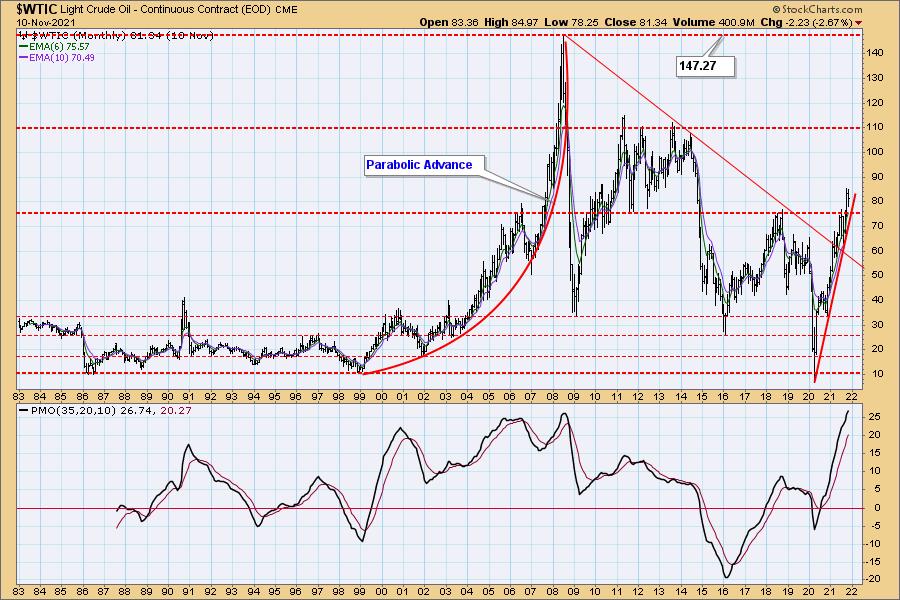
As the Biden administration considers closing a second pipeline, price has already broken through the resistance line drawn across the 2018 top, and has reached a new high of 85/bbl. The next clear line of resistance is at 110/bbl, and I think that level is well within reach after a period of consolidation. In more normal times I might see 110 as the probable top of the range, but now I'm not so sure. Whether or not a run to 147 is possible remains to be seen, but with no reasonable actions being taken to curb raging inflation, it is not out of the question.
CONCLUSION: The long range chart gives us an idea of where the price of crude oil might go, based upon where it has already been. Unfortunately, the extreme volatility of last 20 years is likely to be the model for the foreseeable future.

Click here to register in advance for the recurring free DecisionPoint Trading Room! Recordings are available!
Technical Analysis is a windsock, not a crystal ball.
--Carl Swenlin
(c) Copyright 2021 DecisionPoint.com
Helpful DecisionPoint Links:
DecisionPoint Alert Chart List
DecisionPoint Golden Cross/Silver Cross Index Chart List
DecisionPoint Sector Chart List
Price Momentum Oscillator (PMO)
Swenlin Trading Oscillators (STO-B and STO-V)
DecisionPoint is not a registered investment advisor. Investment and trading decisions are solely your responsibility. DecisionPoint newsletters, blogs or website materials should NOT be interpreted as a recommendation or solicitation to buy or sell any security or to take any specific action.


