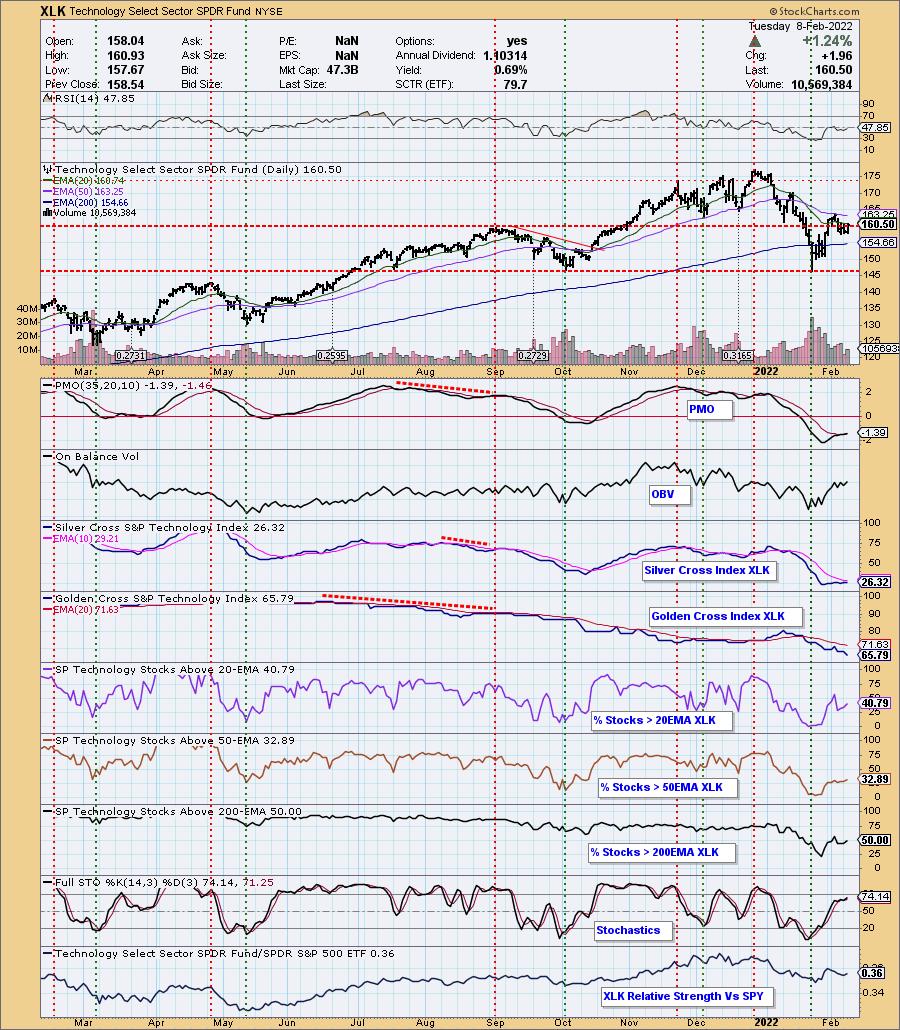
We had two sectors trigger new Price Momentum Oscillator (PMO) BUY signals today, Technology (XLK) and Healthcare (XLV). Let's look "under the hood" to see whether these PMO BUY signals mean more upside for both sectors. On the DecisionPoint.com website, subscribers have access to our "under the hood" sector charts that Carl keeps freshly annotated. They spotlight "participation" using %Stocks > 20/50/200-day EMAs and the Silver Cross Index (SCI)/Golden Cross Index (GCI).
Technology is actually pulling back a bit after failing to overcome resistance at the 50-day EMA. Despite a strong rally today, price closed below the 20-day EMA. The PMO may've triggered a crossover BUY signal, but the RSI is still in negative territory suggesting price weakness. There are pluses in addition to the PMO BUY signal. Participation of %Stocks > 20/50/200-EMAs is rising. %Stocks > 20/50-EMAs are higher than the Silver Cross Index (SCI) reading. This tells us that the SCI should continue to move higher since it measures %Stocks with a 20-EMA > 50-EMA. The Golden Cross Index (GCI) is still in decline and the %Stocks > 200-EMA is less than the GCI. This tells us that the long-term bias and foundation are bearish. Be careful with your positions in this sector.


Click here to register in advance for the recurring free DecisionPoint Trading Room! The most recent recording is below:
Topic: DecisionPoint Trading Room
Start Time: Feb 7, 2022 09:01 AM
Meeting Recording Link.
Access Passcode: February#7
XLV is consolidating sideways instead of in a declining trend like XLK. The RSI on XLV is positive as it rises above net neutral (50). The SCI is about to cross over its signal line. %Stocks > 20/50-EMAs are both well-above the SCI reading suggesting a bullish short-term bias. %Stocks > 200-day EMA is rising, but is not greater than the GCI which continues lower suggesting like XLK, there is still long-term weakness. Stochastics are rising and are above 80 which is bullish. When we compare these two sectors, XLV appears to have the stronger chart with "under the hood" indicators showing higher participation within that sector.
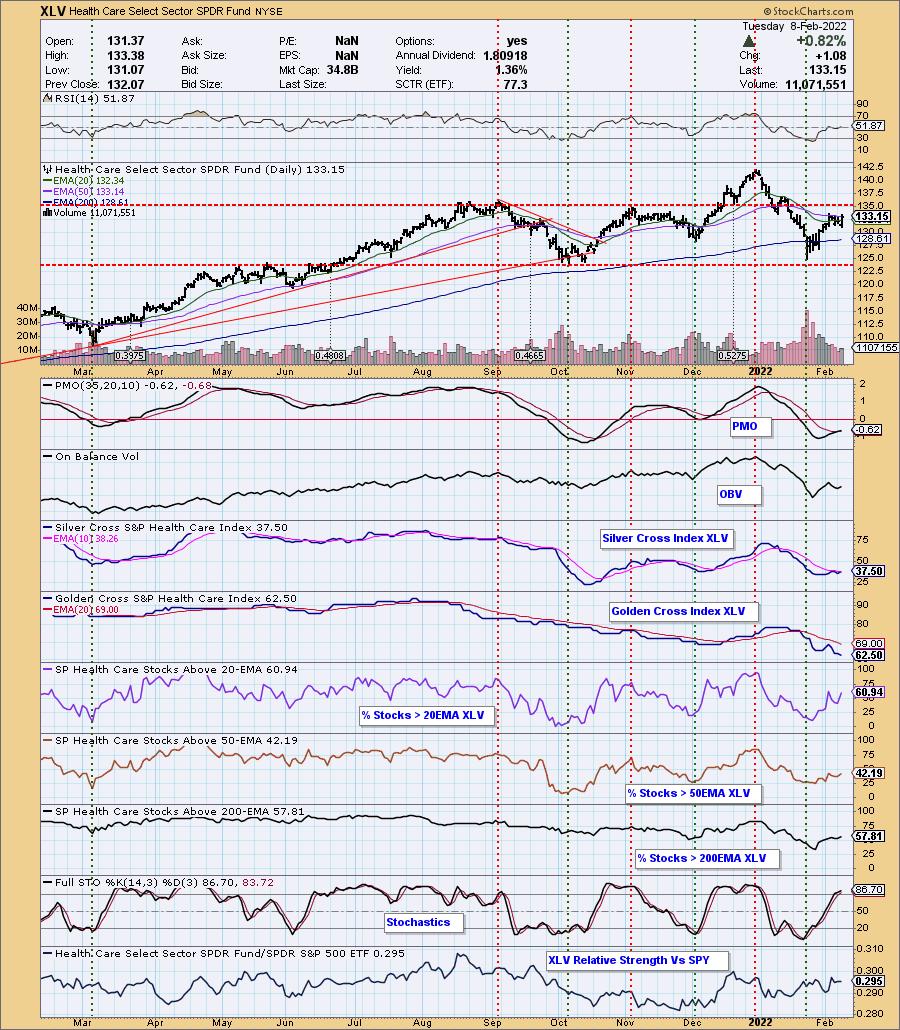
Conclusion: While both of these sectors are showing a strong shift in upside momentum, there are still problems, particularly in the long term. Price needs to trade completely above key moving averages on both of these sectors before we can trust them.
Best,
Erin Swenlin, VP & Senior Technical Analyst DecisionPoint.com
Technical Analysis is a windsock, not a crystal ball. --Carl Swenlin
(c) Copyright 2022 DecisionPoint.com
Helpful DecisionPoint Links:
DecisionPoint Alert Chart List
DecisionPoint Golden Cross/Silver Cross Index Chart List
DecisionPoint Sector Chart List
Price Momentum Oscillator (PMO)
Swenlin Trading Oscillators (STO-B and STO-V)
DecisionPoint is not a registered investment advisor. Investment and trading decisions are solely your responsibility. DecisionPoint newsletters, blogs or website materials should NOT be interpreted as a recommendation or solicitation to buy or sell any security or to take any specific action.


