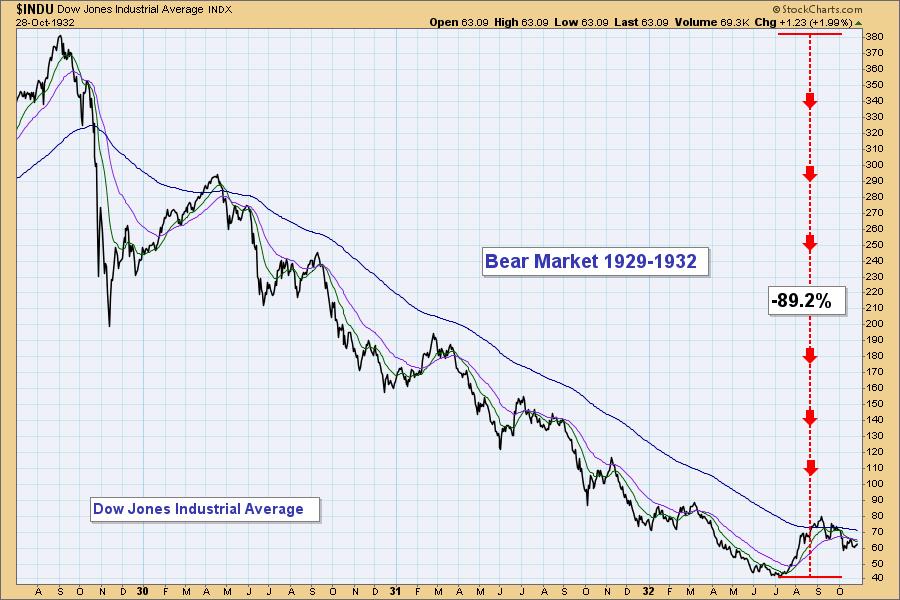
Periodically, to scare the kiddies we bring out the boogie man chart of the 1929-1932 Bear Market. It is a stunning picture upon which I have gazed many times. A decline of nearly ninety percent in just under three years. Recently,it occurred to me that there is much more going on in that picture than I have heretofore realized. Inside this monster secular bear market are a series of "cyclical" bear and bull markets. I've put parents around the word cyclical because this series of reversals was far from what we consider normal. A typical bull/bear market cycle is about four years -- 2.5 years for the bull and 1.5 years for the bear. At least, that's what I was told. All in all I can't say that reality fits that template most of the time. Certainly not of late.
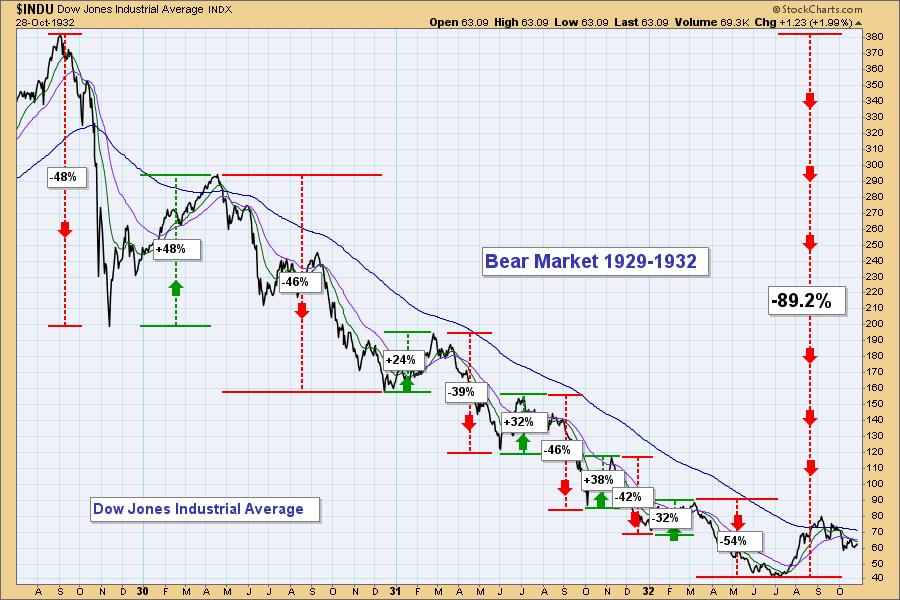
If we define a bull or bear market as being a price move of over 20%, from the 1929 top to the 1932 bottom there were six bear markets and five bull markets. Just eyeballing the duration of each one, we have 10 that were five months or less, and one that lasted eight months. Then after the final bear market bottom, the Dow doubled in two months (not annotated). Talk about volatility.
The point of my showing this ancient history is that it is probably a way you haven't looked at it before. It also reminds me of the kind of volatility we have witnessed in the last few years. And with the hair-trigger trading systems that abound, we're likely to see a lot more of the same. How you are going operate in these conditions is something to think about.
-- Carl Swenlin

Technical Analysis is a windsock, not a crystal ball. --Carl Swenlin
(c) Copyright 2022 DecisionPoint.com
Helpful DecisionPoint Links:
DecisionPoint Alert Chart List
DecisionPoint Golden Cross/Silver Cross Index Chart List
DecisionPoint Sector Chart List
Price Momentum Oscillator (PMO)
Swenlin Trading Oscillators (STO-B and STO-V)
DecisionPoint is not a registered investment advisor. Investment and trading decisions are solely your responsibility. DecisionPoint newsletters, blogs or website materials should NOT be interpreted as a recommendation or solicitation to buy or sell any security or to take any specific action.


