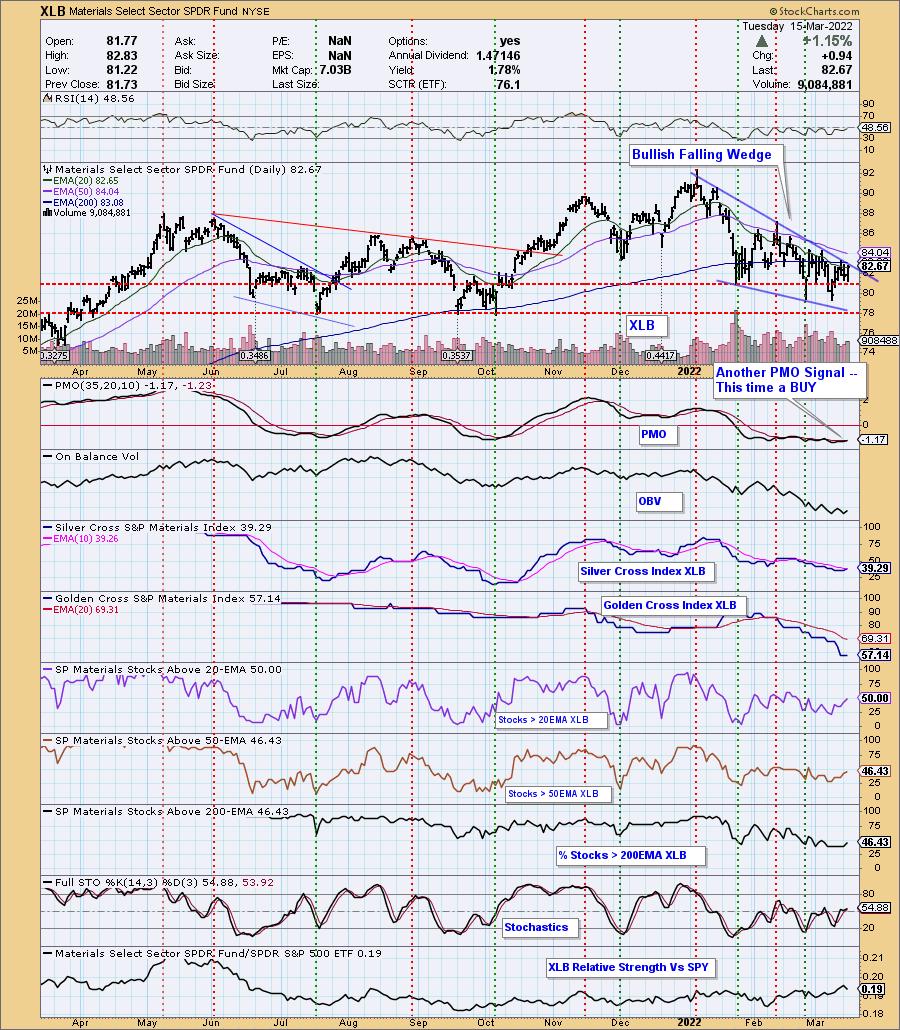
I have alerts set up to tell me when the eleven S&P sectors have Price Momentum Oscillator (PMO) crossovers to the upside or the downside. Materials (XLB) have been popping out PMO crossover signals for over a month. Do we trust this BUY signal right now? Maybe.
There are bullish aspects to the chart. I spotted a bullish falling wedge pattern. It won't be confirmed until we get a breakout, and I wouldn't trust a breakout unless we see price vault the 50-day EMA.
The RSI is negative, which tells us that price is currently in the bottom of its two-week price range (reading below 50). Yet, on the bullish side, we have the "Silver Cross Index" (%Stocks with a 20-day EMA > 50-day EMA) about to give us a positive crossover. Of course, we also note that the SCI is at a bearish 39%. The %Stocks > 20/50-day EMAs are higher than the SCI, suggesting a neutral to short-term bullish bias.
The long-term bias is firmly bearish, given that the %Stocks > 50/200-day EMAs are less than the "Golden Cross Index" (GCI) reading (GCI tells us the %Stocks with a 50-day EMA above the 200-day EMA). This tells us that we won't see an upside reversal on the GCI.
Explanation of PARTICIPATION and BIAS Assessment:
- Intermediate-Term - the Silver Cross Index (SCI) shows the percentage of SPX stocks on IT Trend Model BUY signals (20-EMA > 50-EMA). The opposite of the Silver Cross is a "Dark Cross" -- those stocks are, at the very least, in a correction.
- Long-Term - the Golden Cross Index (GCI) shows the percentage of SPX stocks on LT Trend Model BUY signals (50-EMA > 200-EMA). The opposite of a Golden Cross is the "Death Cross" -- those stocks are in a bear market.
Bottom Line: I like Materials (XLB), but not all of the industry groups are contributing. Additionally, with Gold pulling back, Miners are also pulling back. I might consider a purchase of XLB if it does find purchase above the 50-day EMA, which would also confirm the bullish falling wedge.
Good Luck & Good Trading!
Erin Swenlin
Vice-President & Senior Technical Analyst, DecisionPoint.com


Click here to register in advance for the recurring free DecisionPoint Trading Room! Recordings are available!
Technical Analysis is a windsock, not a crystal ball. --Carl Swenlin
(c) Copyright 2022 DecisionPoint.com
Helpful DecisionPoint Links:
DecisionPoint Alert Chart List
DecisionPoint Golden Cross/Silver Cross Index Chart List
DecisionPoint Sector Chart List
Price Momentum Oscillator (PMO)
Swenlin Trading Oscillators (STO-B and STO-V)
DecisionPoint is not a registered investment advisor. Investment and trading decisions are solely your responsibility. DecisionPoint newsletters, blogs or website materials should NOT be interpreted as a recommendation or solicitation to buy or sell any security or to take any specific action.


