This is an excerpt from today's subscriber-only DecisionPoint Alert report...
We decided to cover some sentiment charts on the DecisionPoint Show yesterday. It is an interesting picture. Clearly sentiment is bearish. The question is whether it is bearish enough to start expecting a bear market bottom.
Let's first talk about sentiment in a general sense. The idea behind using sentiment indicators is to determine when investors have reached a saturation point of bullishness or bearishness. For example, tops are formed when everybody who is going to buy has bought, while bottoms occur after there is no one left to sell. Using subjective measures like sentiment polls makes it difficult to determine exactly when these extremes have been reached; polls have never been particularly good for bottom or top picking. We use three charts that are based on the "numbers" not emotional polls: Rydex Ratio, Put/Call Ratios and National Association of Active Investment Managers (NAAIM) Exposure.
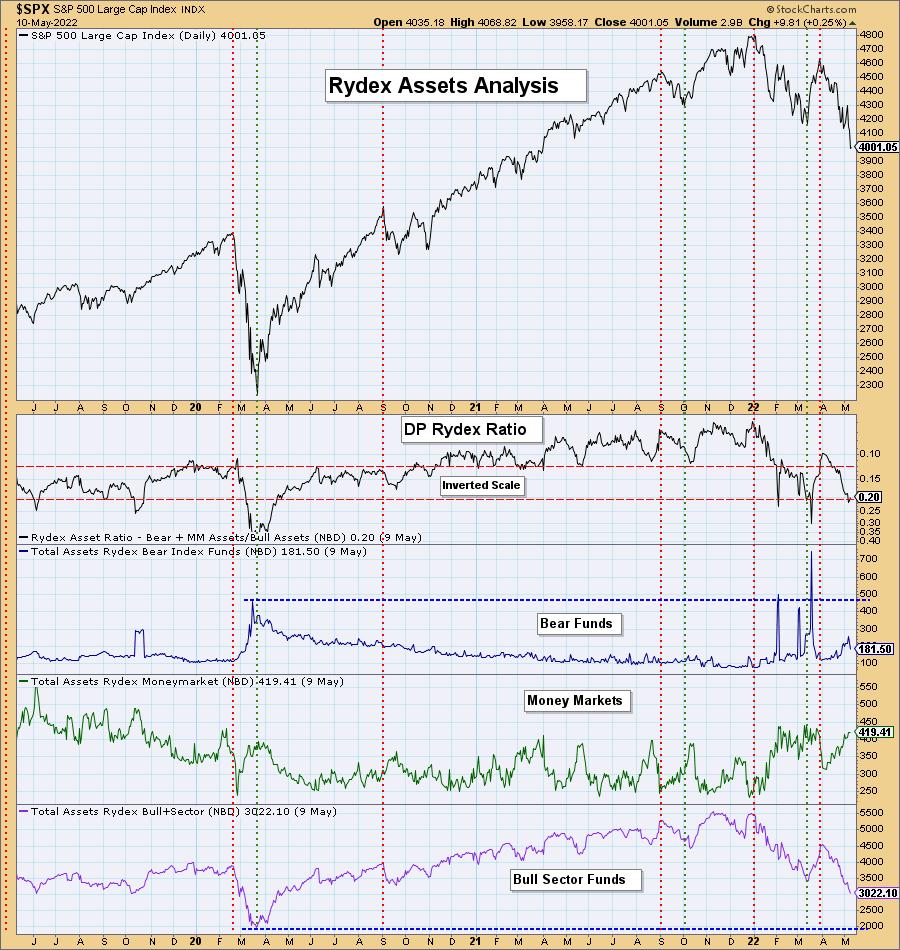
We will start with our Rydex Ratio analysis chart. All Rydex mutual funds were renamed after the Rydex company was purchased by Guggenheim Investments, but we continue to use the legacy "Rydex" name for the ratios. It is a closed group of funds that consist of bear funds, money markets and bull sector funds. It is a "money where your mouth is" indicator. Rather than get a poll, we track how much money goes into bear/money market funds versus bull/sector funds.
The ratio is calculated by taking the bear/money market funds divided by bull funds. The lower the ratio, the more bullish investors are and conversely, the higher the ratio, the more bearish investors are. We invert the Rydex Ratio so that oversold readings are on the bottom and overbought readings are on the top. Please note that the data for the ratio doesn't come in until late evening.
We can see that investors have moved out of bull/sector funds and into cash. We are seeing an increase in bear funds, but not to the level we saw at the end of the 2020 bear market. We've also have not seen the same amount of money in bull funds as at the end of 2020 bear market. This is reflected in the Rydex Ratio which is also not as low as it was at the end of 2020 bear market.

ESSENTIAL Bear Market Analysis
Most investors and traders haven't experienced a "real" bear market. WE HAVE!
Our subscriptions are priced to allow all investors access to professional grade analysis! Beginners to advanced, all can learn our analysis process!
$35/month for our cornerstone DP Alert market letter with coverage of Gold, Gold Miners, Yields, the Dollar, Crude Oil, Bitcoin and MORE!
$40/month for DecisionPoint Diamonds, ten+ handpicked stocks or "Diamonds in the Rough" AND a weekly subscriber-only Diamond Mine trading room!
$68/month for BOTH!
Click HERE to subscribe now!
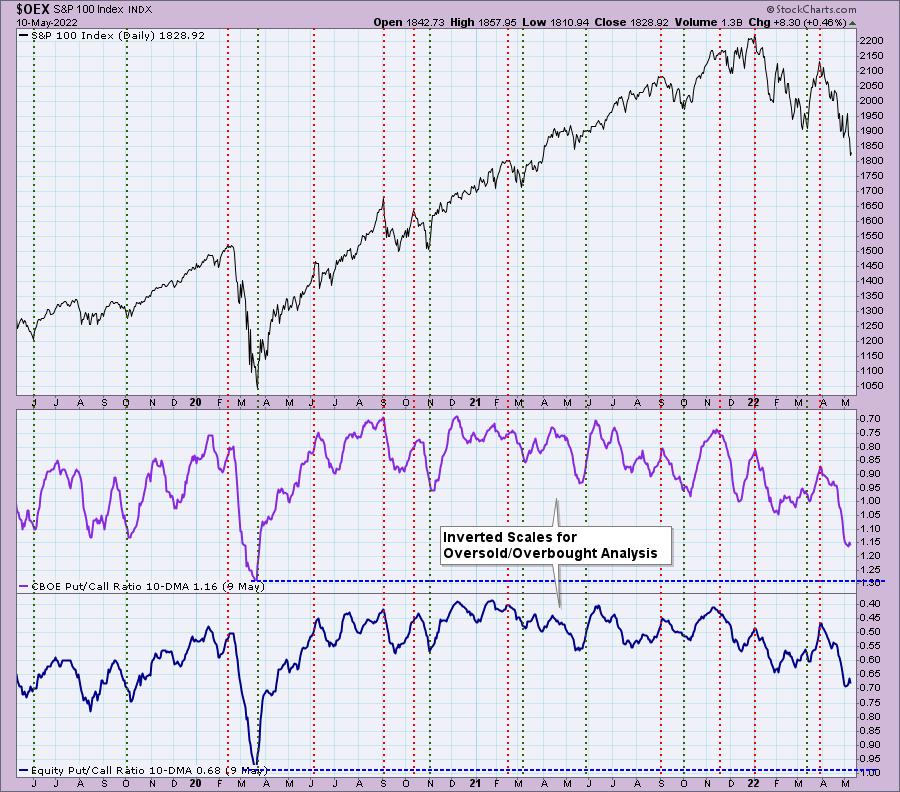
The put/call ratios are certainly extended on our inverted scale; but again, these ratios are not nearly as bearish as they were at the end of the 2020 bear market. Data for put/call ratios comes in later in the evening so these numbers are from yesterday.

Click here to register in advance for the recurring free DecisionPoint Trading Room! Recordings are available!
The NAAIM Exposure Index certainly shows that money managers are less exposed, but we aren't seeing the same lows in exposure as we did at the end of the 2020 bear market. Data is released late on Thursdays so the second bar is a duplicate of the last data point.
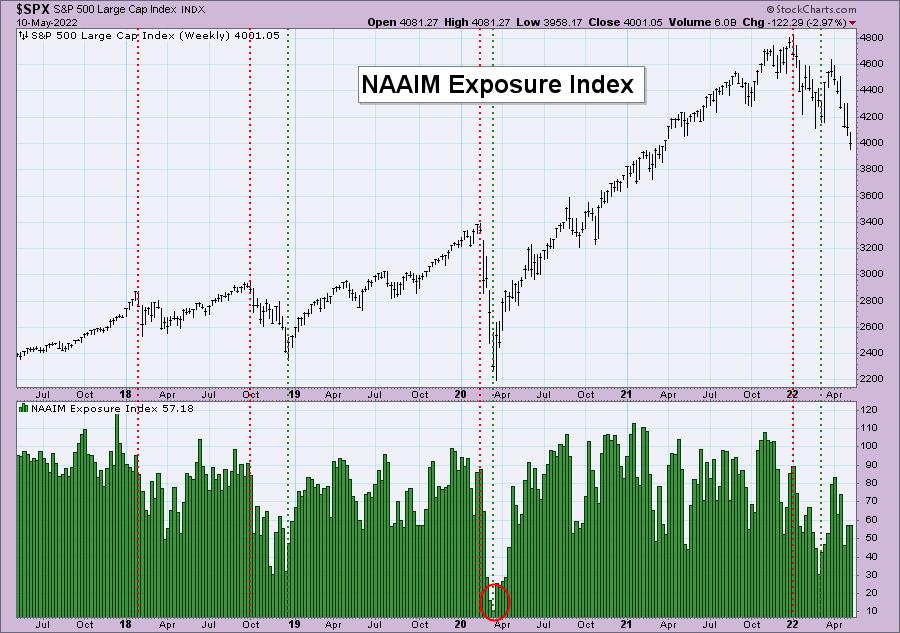
Conclusion: Bearish sentiment and exposure are not at the capitulation levels we saw at the end of the 2020 bear market. If you're banking on a reversal because everyone is polling bearish, note that the money flows and exposure aren't reflecting sentiment as bearish enough.
Good Luck & Good Trading!
Erin Swenlin
Technical Analysis is a windsock, not a crystal ball. --Carl Swenlin
(c) Copyright 2022 DecisionPoint.com
Helpful DecisionPoint Links:
DecisionPoint Alert Chart List
DecisionPoint Golden Cross/Silver Cross Index Chart List
DecisionPoint Sector Chart List
Price Momentum Oscillator (PMO)
Swenlin Trading Oscillators (STO-B and STO-V)
DecisionPoint is not a registered investment advisor. Investment and trading decisions are solely your responsibility. DecisionPoint newsletters, blogs or website materials should NOT be interpreted as a recommendation or solicitation to buy or sell any security or to take any specific action.


