. . . are doomed to repeat it." The essence of that pithy observation is generally attributed to writer and philosopher George Santayana. I don't think it is usually applied to the stock market, but it should be, and looking at historical charts is the best way to learn from history.
I have looked at the 1929-1932 Bear Market chart many times over the last 40 years, but it was always with an emphasis on the 1929 Crash and the nearly -90% decline into the 1932 bottom. Recently, I realized that there was something else just as interesting and added new annotations to the chart. If we assume that a decline of over -20% is a bear market, and an advance of over +20% is a bull market, it is shocking how to realize how confusing that period must have been for investors. The decline from the 1929 top to the 1932 bottom was a secular bear market, but also within that period there were six cyclical bear markets and five cyclical bull markets. Eleven reversals in 32 months!
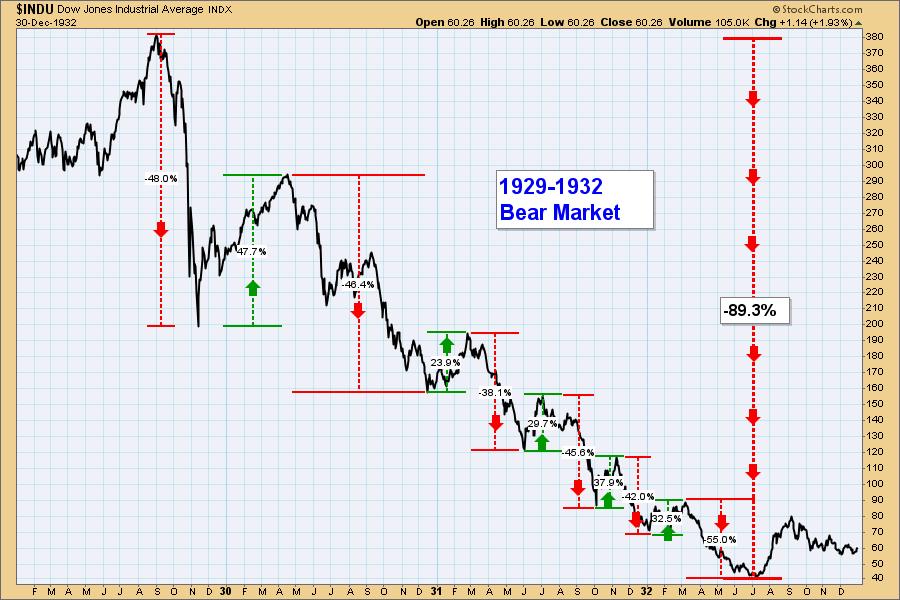
Do I think we're in for a thrashing of this magnitude? Well, remember that during the 2000-2002 Bear Market the Nasdaq Composite declined about -80%, and the Nasdaq 100 (QQQ) about -85%. Nobody knows what is really going to happen, but the Nasdaq Composite and Nasdaq 100 are already down -32%, and it is well to remember that, depending one's exposure, catastrophic losses are not just myths relegated to the bad old days. As for whiplash reversals like those on the chart, it is too soon to tell, but the 2020 Bear Market demonstrates that it is not out of the question.
-- Carl Swenlin

Technical Analysis is a windsock, not a crystal ball. --Carl Swenlin
(c) Copyright 2022 DecisionPoint.com
Helpful DecisionPoint Links:
DecisionPoint Alert Chart List
DecisionPoint Golden Cross/Silver Cross Index Chart List
DecisionPoint Sector Chart List
Price Momentum Oscillator (PMO)
Swenlin Trading Oscillators (STO-B and STO-V)
DecisionPoint is not a registered investment advisor. Investment and trading decisions are solely your responsibility. DecisionPoint newsletters, blogs or website materials should NOT be interpreted as a recommendation or solicitation to buy or sell any security or to take any specific action.


