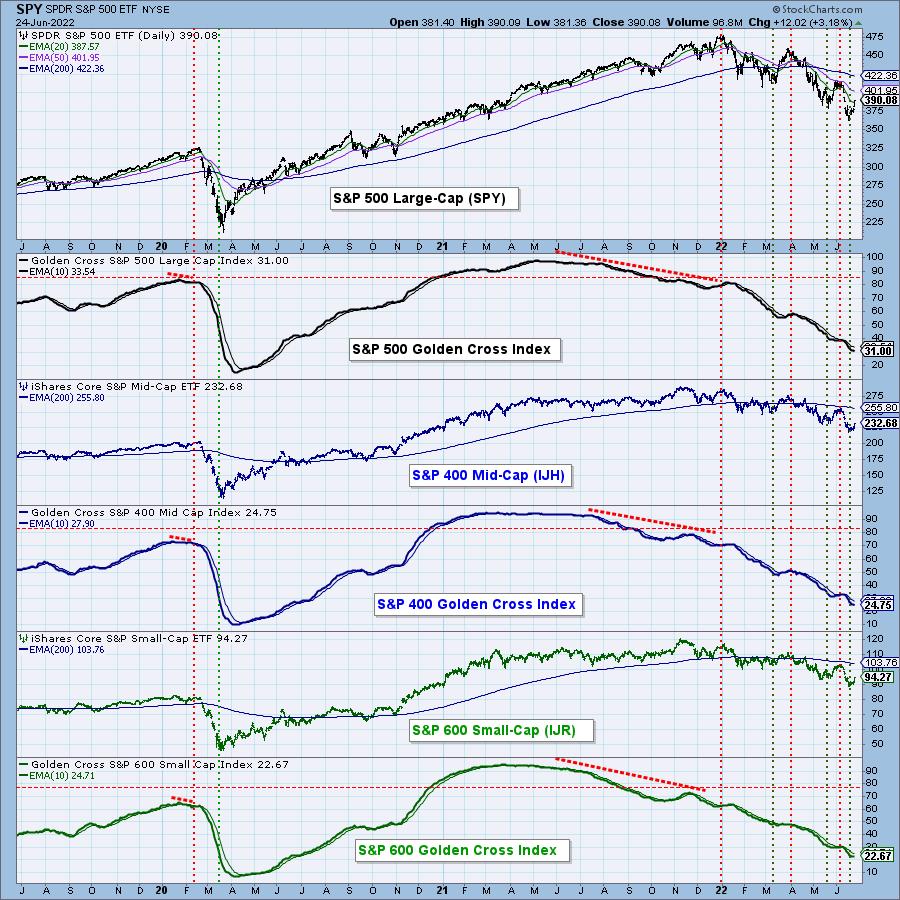
When the 50-EMA crosses up through the 200-EMA, it is commonly known as a Golden Cross, because it infers a positive long-term price trend. Our Golden Cross Index (GCI) shows the percentage of stocks in a given index with a golden cross condition. This chart shows the GCI readings for the S&P 500 Large-Cap, S&P 400 Mid-Cap and S&P 600 Small-Cap Indexes, which are (rounded) 32, 25 and 23, respectively. We consider a reading below 50 to indicate a bear market, and we are well below that in all three groups. Nevertheless, the readings are still not as low as they got during the 2020 Bear Market. Note how all the GCIs dropped lower in 2021 (negative divergence) as the market reached all-time highs.

Now more than ever, you need DecisionPoint analysis! Let us help you maneuver through treacherous market conditions! We have put together a "Bear Market" discount. Right now, using Coupon Code: BEARS, you can get your first month of the "Bundle" package for only $14 (regularly $68)! Cancel anytime! If you decide you only want just the DP Alert or just DP Diamonds, notify us and we'll adjust your account.
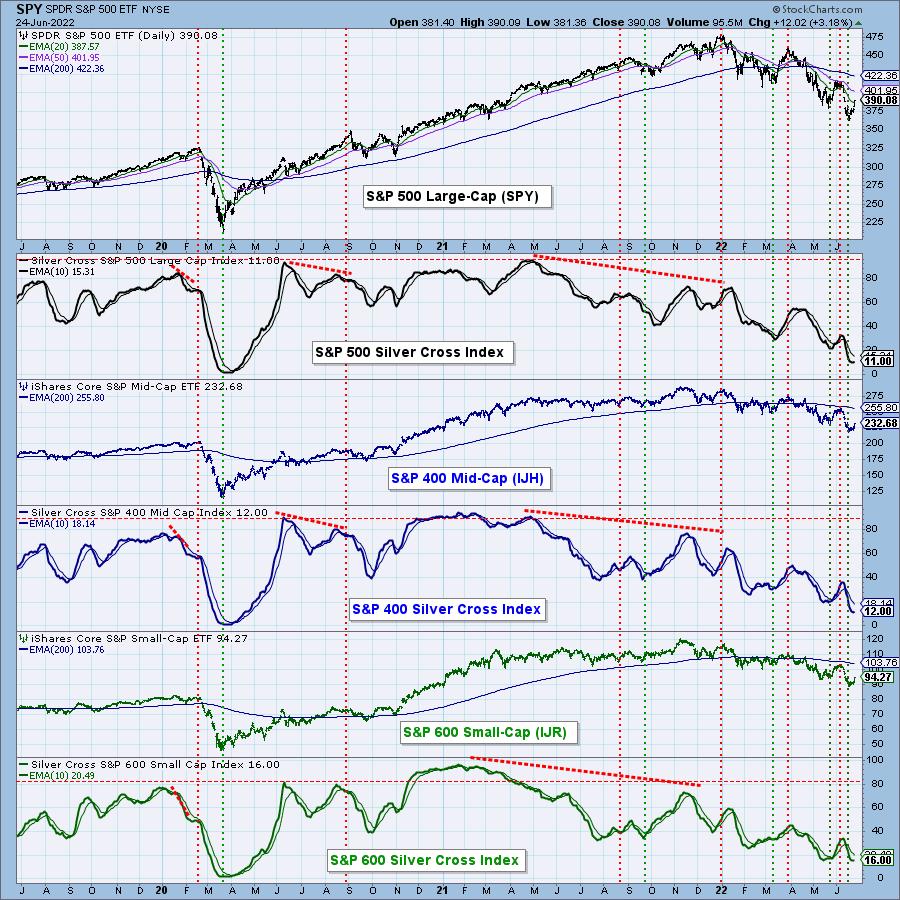
For years, we have used the 20-EMA and 50-EMA upside crossover as an indication of intermediate-term bullishness (we call it the "Silver Cross," indicating that it is a companion for the Golden Cross Index), and we have created the Silver Cross Index (SCI) to reflect the intermediate-term condition of market indexes. This chart shows the SCI readings for the S&P 500, 400 and 600 Indexes, which are 10, 12 and 16 respectively. Again, those readings are not as bad as 2020, but they are dismal nonetheless.
For the last four days, the market has been rallying, so we will probably see both the GCI and SCI turn up soon. With these and other indicators being at such oversold levels, the rally could be quite persistent. We shall see.
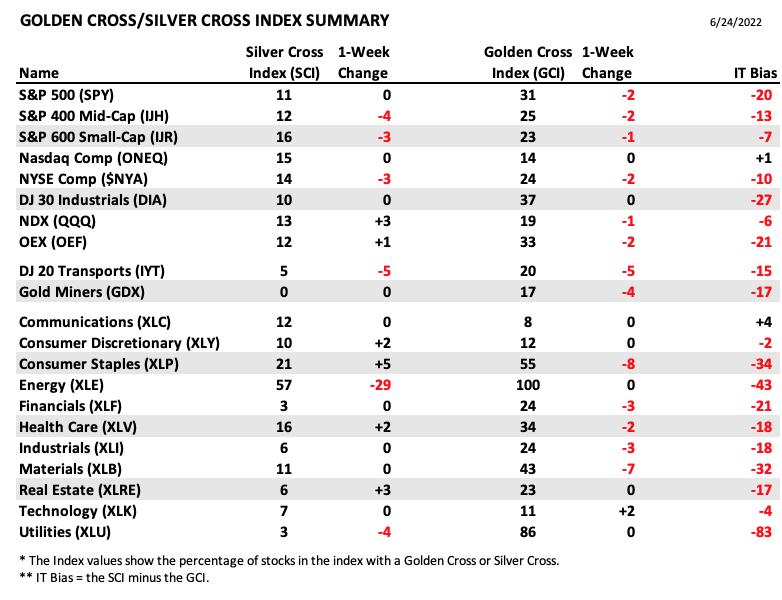
Conclusion: The Golden Cross and Silver Cross Indexes provide an excellent, in-depth assessment of the long-term and intermediate-term condition of the market. They show us how many stocks are participating in price movement up or down. We have these indicators for 21 market and sector indexes. Here is our table with the latest results:
Technical Analysis is a windsock, not a crystal ball. --Carl Swenlin
(c) Copyright 2022 DecisionPoint.com
Helpful DecisionPoint Links:
DecisionPoint Alert Chart List
DecisionPoint Golden Cross/Silver Cross Index Chart List
DecisionPoint Sector Chart List
Price Momentum Oscillator (PMO)
Swenlin Trading Oscillators (STO-B and STO-V)
DecisionPoint is not a registered investment advisor. Investment and trading decisions are solely your responsibility. DecisionPoint newsletters, blogs or website materials should NOT be interpreted as a recommendation or solicitation to buy or sell any security or to take any specific action.


