DecisionPoint Diamonds scans have failed to produce. In order to get even a few results, we have had to ease the restrictions, particularly on EMA configurations. If we don't get scan results for "Diamonds in the Rough", we dive into the Industry Summary on StockCharts.com so we can find pockets of strength. Well... there are none.
As of yesterday, EVERY industry group had declining Price Momentum Oscillators (PMOs). Today, two PMOs managed to rise a hundredth of a point. Technically that is positive momentum, but these groups are still very suspect.
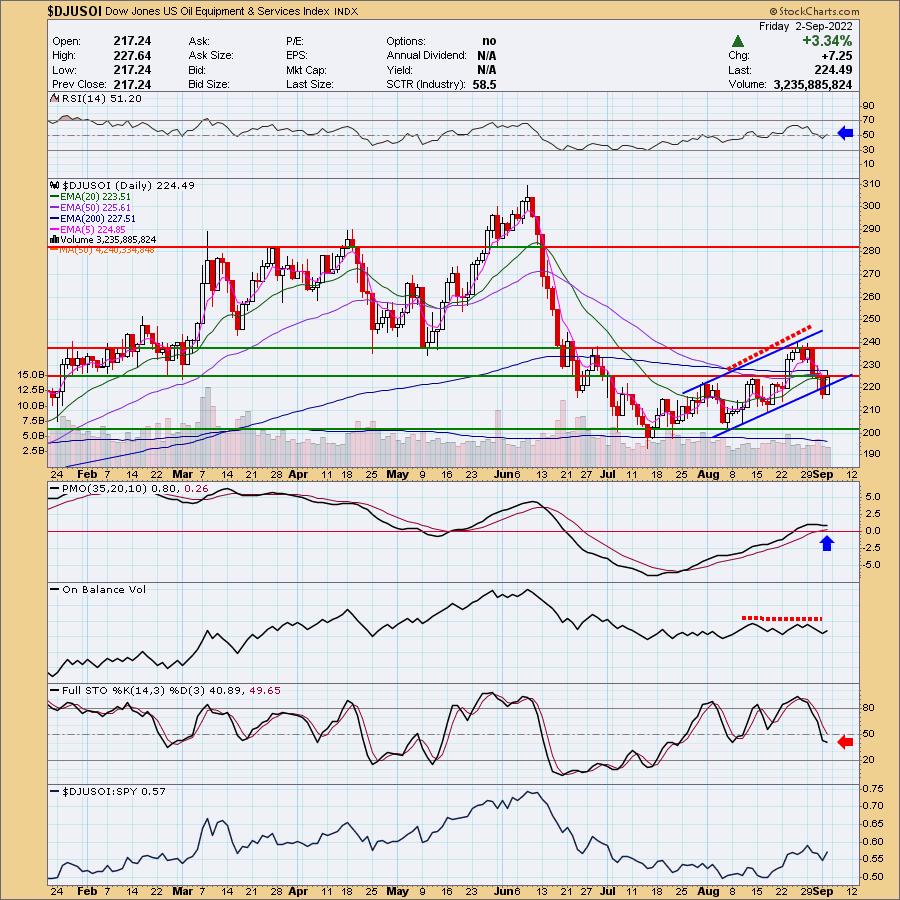
The first is Oil & Equipment Services ($DJUSOI). The price chart is murky at best, but there are a few signs of life. The RSI entered positive territory above net neutral (50) today. As noted in the opening, the PMO has turned up above both the zero line and signal line, which is usually considered very bullish. While price did rebound and closed above the short-term rising trend, it stayed beneath at the 50-day EMA and February lows.
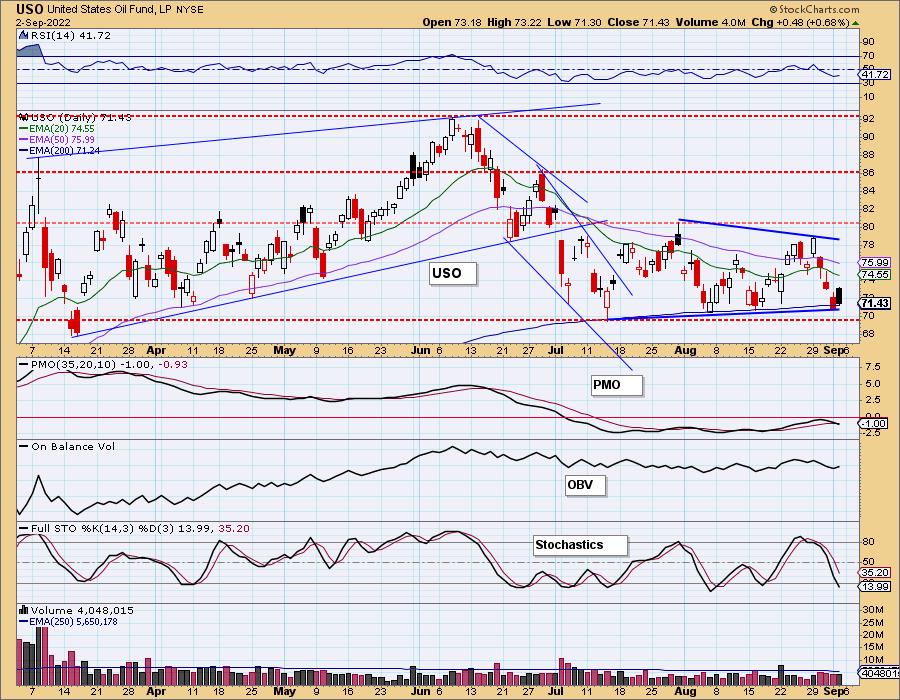
The Crude Oil chart (USO) is far from encouraging. Yes, there was a rally today, but it finished with a bearish filled black candlestick. Indicators are still very negative. Until this chart looks more healthy, I would be careful with this industry group.

The other industry group that saw rising momentum was Gold Mining ($DJUSPM). The Mining ETF ($DJUSMG) is still showing declining momentum.
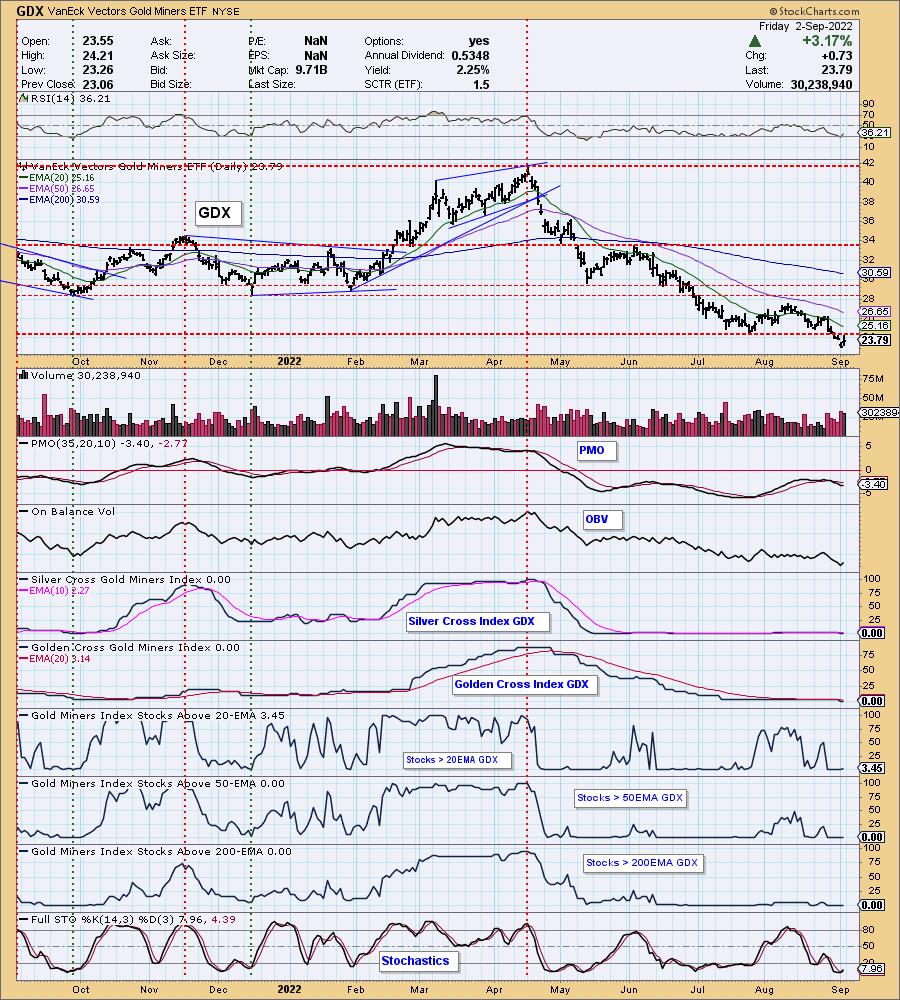
We've been writing in the DP Alert that Gold Miners are beat down and really vulnerable to more decline. Instead of using the industry group chart, we are going to use GDX. We have "under the hood" indicators available to us on that chart.
Currently, GDX is at 52-week lows and, after the recent breakdown below the July low, we've warned that this group isn't likely to rebound anytime soon. The big problem for Gold Miners is the complete lack of participation. You'll notice 0% for nearly all participation indicators with the exception of one or two stocks with price above their 20-day EMA. Gold had a good day, and that likely spurred GDX on.
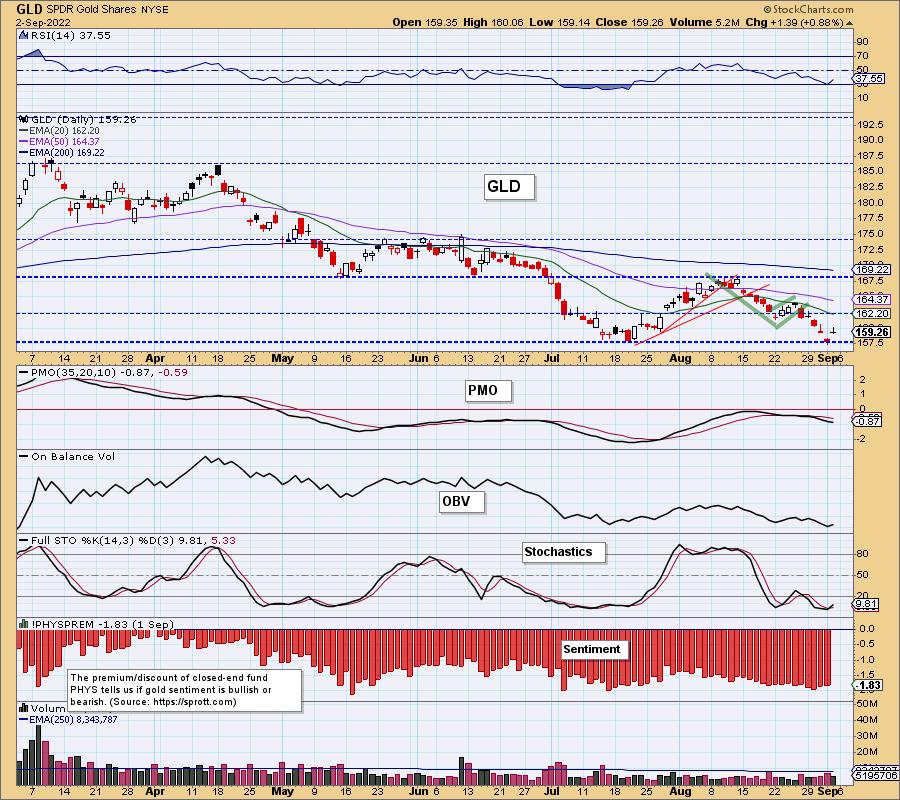
The Gold chart is showing improvement with today's rally, sort of. If Gold can continue to rally, fishing from the Gold Miners would be palatable. However, Gold Miners aren't merely subject to Gold prices, they are subject to the overall market trend as they are companies, not the metal.
Conclusion: There is nowhere to hide out. Interest rates are skyrocketing so the safety of Bonds is out the window and Gold has not been seen as a safe haven, at least not yet. The safest place is sadly cash or for brave souls, inverse ETFs and shorts.
Good Luck & Good Trading,
Erin Swenlin
Technical Analysis is a windsock, not a crystal ball. --Carl Swenlin
(c) Copyright 2022 DecisionPoint.com
Helpful DecisionPoint Links:
DecisionPoint Alert Chart List
DecisionPoint Golden Cross/Silver Cross Index Chart List
DecisionPoint Sector Chart List
Price Momentum Oscillator (PMO)
Swenlin Trading Oscillators (STO-B and STO-V)
DecisionPoint is not a registered investment advisor. Investment and trading decisions are solely your responsibility. DecisionPoint newsletters, blogs or website materials should NOT be interpreted as a recommendation or solicitation to buy or sell any security or to take any specific action.


