With the market on the cusp of a rally, we thought it time to walk through our Silver Cross Index (SCI) and Golden Cross Index on the broad markets (SPX, NASDAQ and NYSE). Before we look at each chart, let's review what Golden and Silver Crosses are.
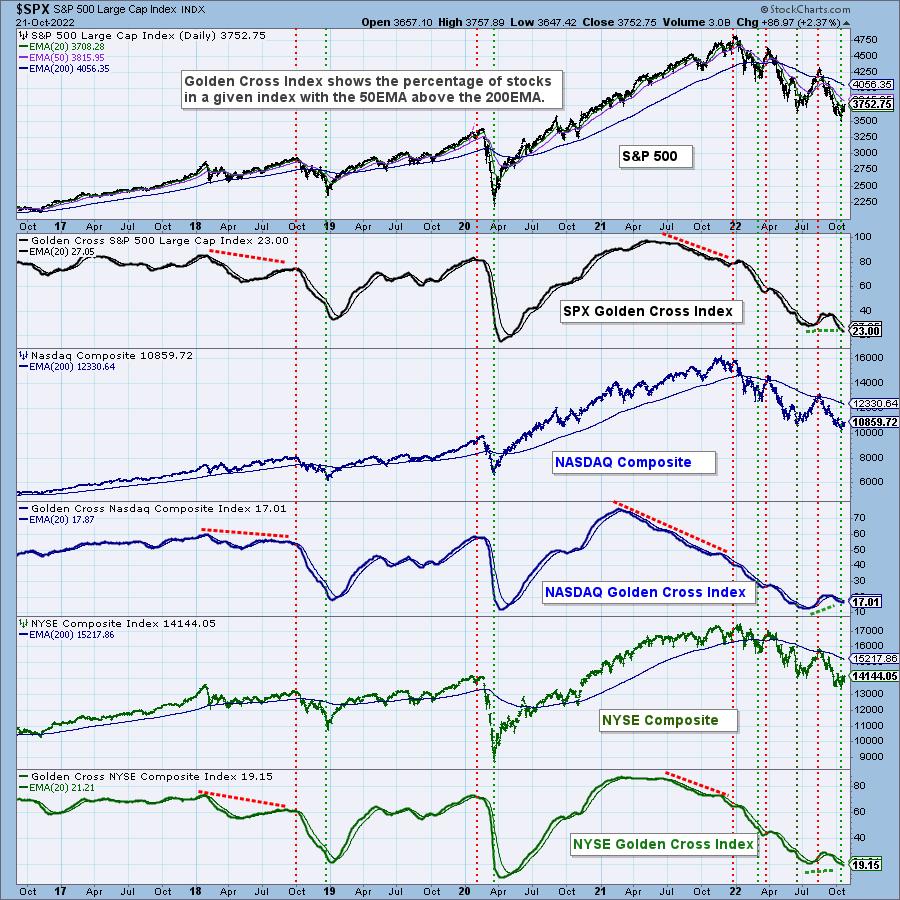
Most people are familiar with a golden cross. It is when the 50-day moving average moves above the 200-day moving average. It can be an SMA or an EMA; we use EMAs. The Golden Cross Index (GCI) measures how many stocks within the named index have a 50-day EMA above the 200-day EMA.
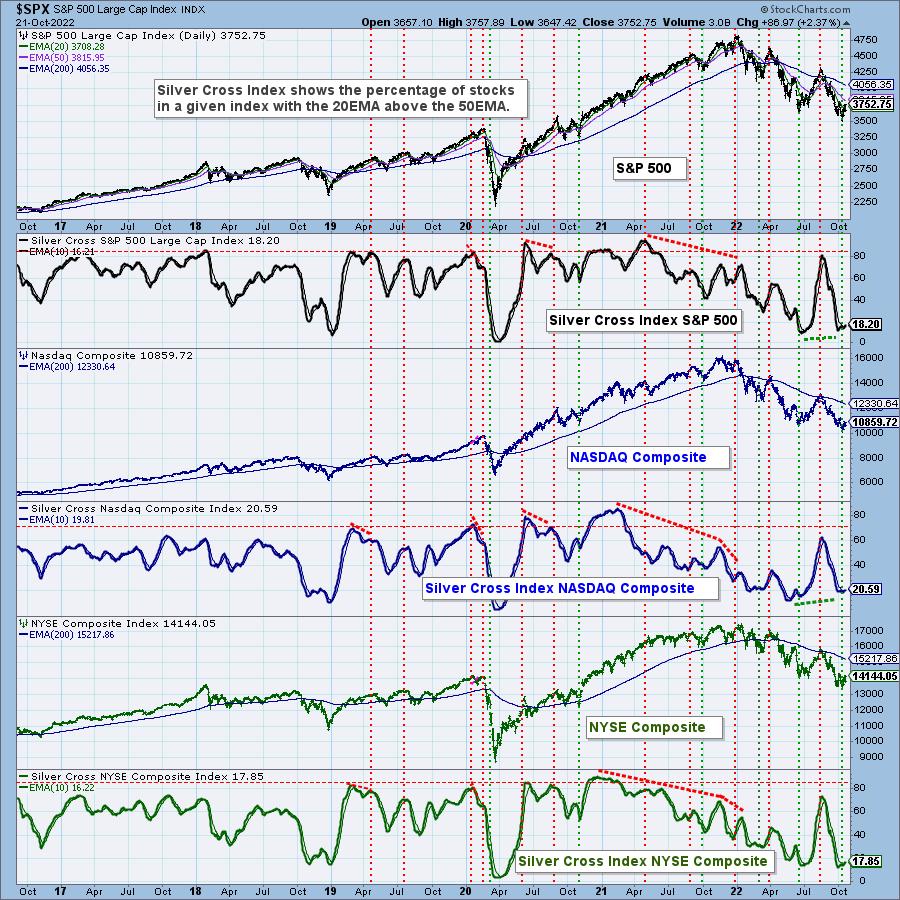
The silver cross is something we came up with to describe a 20-day moving average crossing above the 50-day moving average. Again, we use EMAs. The Silver Cross Index (SCI) measures how many stocks within the named index have a 20-day EMA above their 50-day EMA.
We'll start with the shorter-term SCI chart. In all cases, the SCIs are oversold and at levels we saw before the 2020 bear market recovery, and also before last summer's bear market rally. All three are rising on positive crossovers. In the case of the SPX and Nasdaq, we have positive divergences, with price lows leading into this bear market rally.
The GCI chart is less bullish. On the bright side, readings are oversold, though not as oversold as we've seen previously. Given the up and downs of the GCI all along the way down, we do see positive divergences leading into the current price low. This chart suggests to us that, in the longer term, we are still in a bear market.
Conclusion: We do believe the market is about to pop, but in the meantime we could experience some chop and churn as it angles higher. The SCI tells us, with its positive divergences and signal line crossovers, that the short and intermediate terms are bullish. The GCI suggests the long-term picture is less bullish. This could be telling us this isn't the beginning of a new bull market. The bear may start hibernating, but it is still alive and well.
Good Luck & Good Trading!
Erin Swenlin
If you'd like to try out DecisionPoint.com free for two weeks, use coupon code: DPTRIAL2 at checkout when you subscribe to our "Bundle" package.

Technical Analysis is a windsock, not a crystal ball. --Carl Swenlin
(c) Copyright 2022 DecisionPoint.com
Helpful DecisionPoint Links:
DecisionPoint Alert Chart List
DecisionPoint Golden Cross/Silver Cross Index Chart List
DecisionPoint Sector Chart List
Price Momentum Oscillator (PMO)
Swenlin Trading Oscillators (STO-B and STO-V)
DecisionPoint is not a registered investment advisor. Investment and trading decisions are solely your responsibility. DecisionPoint newsletters, blogs or website materials should NOT be interpreted as a recommendation or solicitation to buy or sell any security or to take any specific action.


