As of today, the Dow Jones Industrial Average has advanced to just over +20% from its October low, which by some standards means it has entered a new bull market. Does that mean that the worst is over and that the rest of the market will follow suit? Maybe.
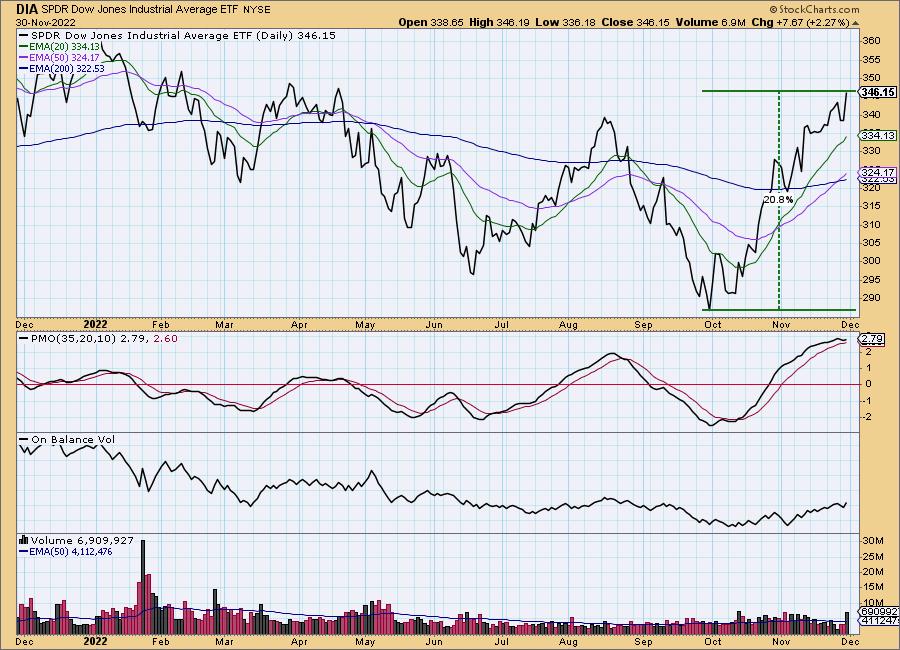
A widely accepted rule is that, when a market index moves +20% from a bear market low, a new bull market has begun. And that is certainly the case for the Dow. Let us see if the other major indexes follow suit. The S&P 500/400/600 and NYSE Composite Indexes are up about +17%, and they could easily make the extra three percent. The Nasdaq 100 is only up +13%.
I personally think we are in a secular bear market, but secular bears can be interrupted by cyclical bull markets. Fundamentally, I think things are too screwed up for the secular bear to be over, but we shall see.
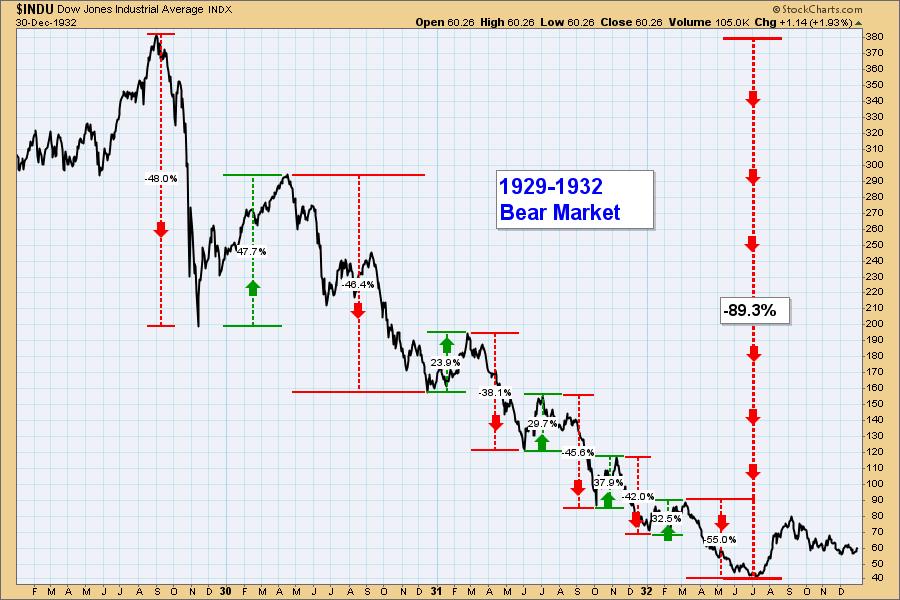
What prompted me to write this article is the following chart that you may have seen before. It shows that the secular 1929-1932 Bear Market consisted of six cyclical bear and five cyclical bull markets. I'm not saying that we are going to repeat this scenario, just demonstrating what can happen.
Conclusion: When we analyze the current bear market, we can see that it was lead by the big technology stocks, and the Dow isn't burdened by as many of them, or their cap-weighting, as the broader indexes are. For this reason the Dow barely reached the -20% decline to qualify for a bear market, and it is now recovering faster as well. But it may be a mistake to expect the broader market indexes to match this progress.
Watch the latest episode of DecisionPoint on StockCharts TV's YouTube channel here!

Technical Analysis is a windsock, not a crystal ball. --Carl Swenlin
(c) Copyright 2022 DecisionPoint.com
Helpful DecisionPoint Links:
DecisionPoint Alert Chart List
DecisionPoint Golden Cross/Silver Cross Index Chart List
DecisionPoint Sector Chart List
Price Momentum Oscillator (PMO)
Swenlin Trading Oscillators (STO-B and STO-V)
DecisionPoint is not a registered investment advisor. Investment and trading decisions are solely your responsibility. DecisionPoint newsletters, blogs or website materials should NOT be interpreted as a recommendation or solicitation to buy or sell any security or to take any specific action.


