The market is currently topping because the Silver Cross Index (SCI), which expresses intermediate-term participation, is overbought and topping. A Silver Cross is when the 20-EMA of a price index crosses up through the 50-EMA. The Silver Cross Index shows the percentage of stocks in a market or sector index that have a made a Silver Cross. The SCI currently has a reading of 75 percent, having fallen from a top of about 80.
On the chart below, we also have the source indicators for the Silver Cross Index. The Percent Stocks Above 20-EMA reads 50 percent, and the Percent Stocks Above 50-EMA reads 66 percent. If this configuration is maintained, the SCI will necessarily fall to about 66. Such a drop in participation will likely have a negative effect on price.
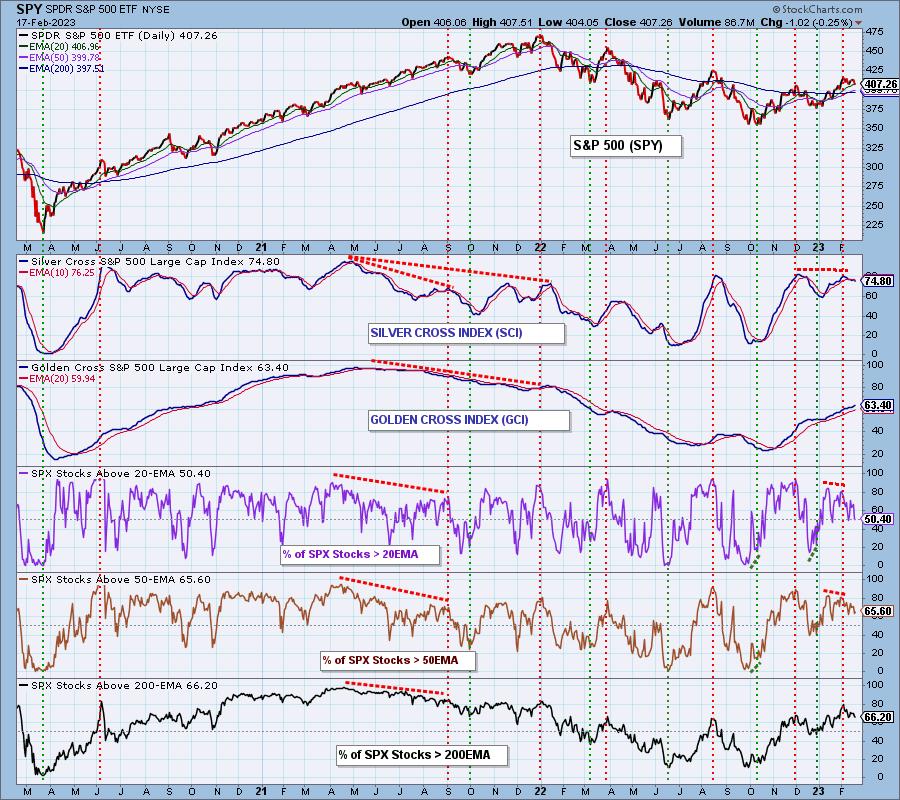
The Golden Cross Index (GCI) tracks the percentage of stocks in the index with a Golden Cross, which is when the 50-EMA crosses up through the 200-EMA. This is an expression of long-term participation. Currently, the source indicators show the Percent Stocks Above 50-EMA at 66 percent, and the Percent Stocks Above 200-EMA at 66 percent. If this configuration is maintained, the GCI has no upside potential.
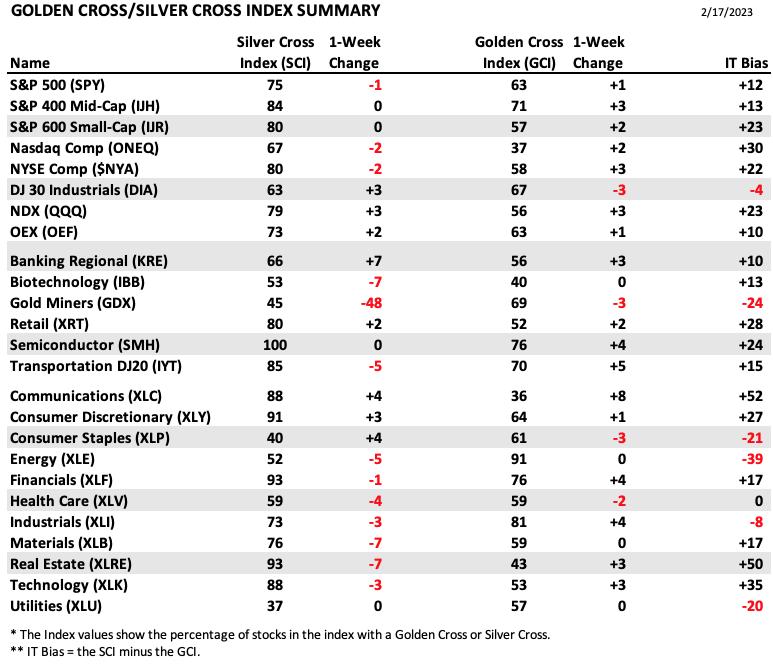
DecisionPoint tracks the Silver Cross and Golden Cross Indexes for 25 market indexes, sectors, and industry groups, and we publish this table in the DecisionPoint ALERT weekly.
CONCLUSION: Deterioration of participation (the SCI) is likely to cause further price decay in the intermediate-term, which will likely see stalled long-term participation (the GCI) begin to decline as well.
Watch the latest episode of DecisionPoint on StockCharts TV's YouTube channel here!

Technical Analysis is a windsock, not a crystal ball. --Carl Swenlin
(c) Copyright 2023 DecisionPoint.com
Helpful DecisionPoint Links:
DecisionPoint Alert Chart List
DecisionPoint Golden Cross/Silver Cross Index Chart List
DecisionPoint Sector Chart List
Price Momentum Oscillator (PMO)
Swenlin Trading Oscillators (STO-B and STO-V)
DecisionPoint is not a registered investment advisor. Investment and trading decisions are solely your responsibility. DecisionPoint newsletters, blogs or website materials should NOT be interpreted as a recommendation or solicitation to buy or sell any security or to take any specific action. Current


