We have begun collecting Silver Cross Index and Golden Cross Index data for four new industry groups, and StockCharts.com back-calculated data for two years: Biotechnology (IBB), Regional Banking (KRE), Retail (XRT), and Semiconductors (SMH).
First let's cover what the Golden/Silver Cross Indexes are:
- The Golden Cross Index (GCI) shows the percentage of stocks on LT Trend Model BUY signals (50-EMA > 200-EMA). The opposite of a Golden Cross is the "Death Cross" -- those stocks are in a bear market.
- The Silver Cross Index (SCI) shows the percentage of stocks on IT Trend Model BUY signals (20-EMA > 50-EMA). The opposite of the Silver Cross is a "Dark Cross" -- those stocks are, at the very least, in a correction.
Let's take a look our new industry group Golden/Silver Cross Indexes:
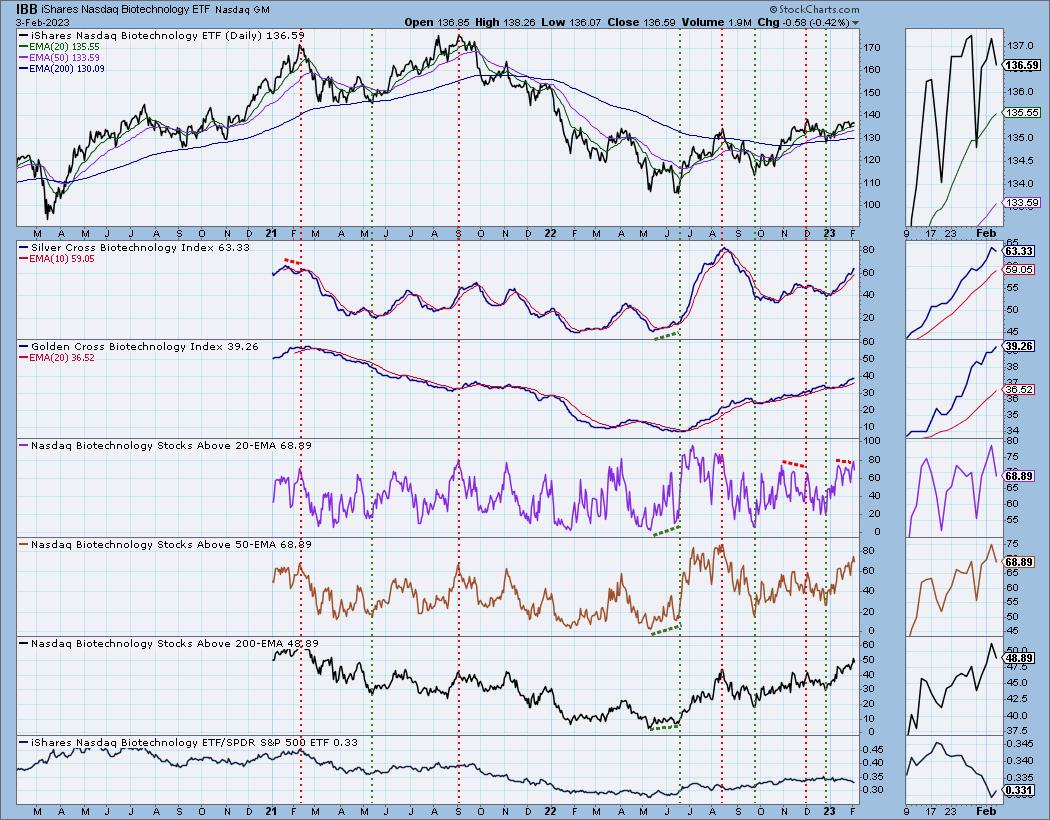
Since mid-January, we have seen the relative strength line falling. However, notice what was going on 'under the hood'. Participation was increasing and the Silver Cross Index was rising. Relative strength was misleading. During this same period, IBB has been in a rising price trend.
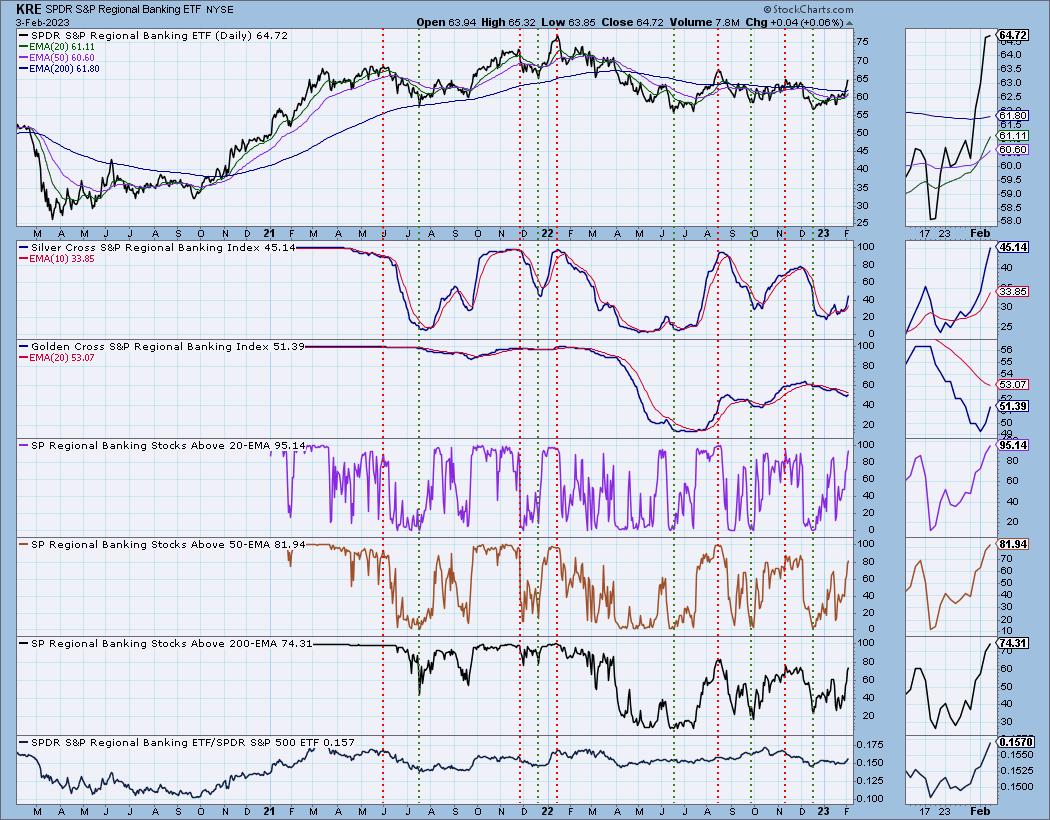
Regional Banks (KRE) has seen participation shooting skyward. The relative strength line is in agreement with participation, which suggests overall strength. Notice the Silver Cross Index moving vertically higher. This is an industry group to pay attention to.
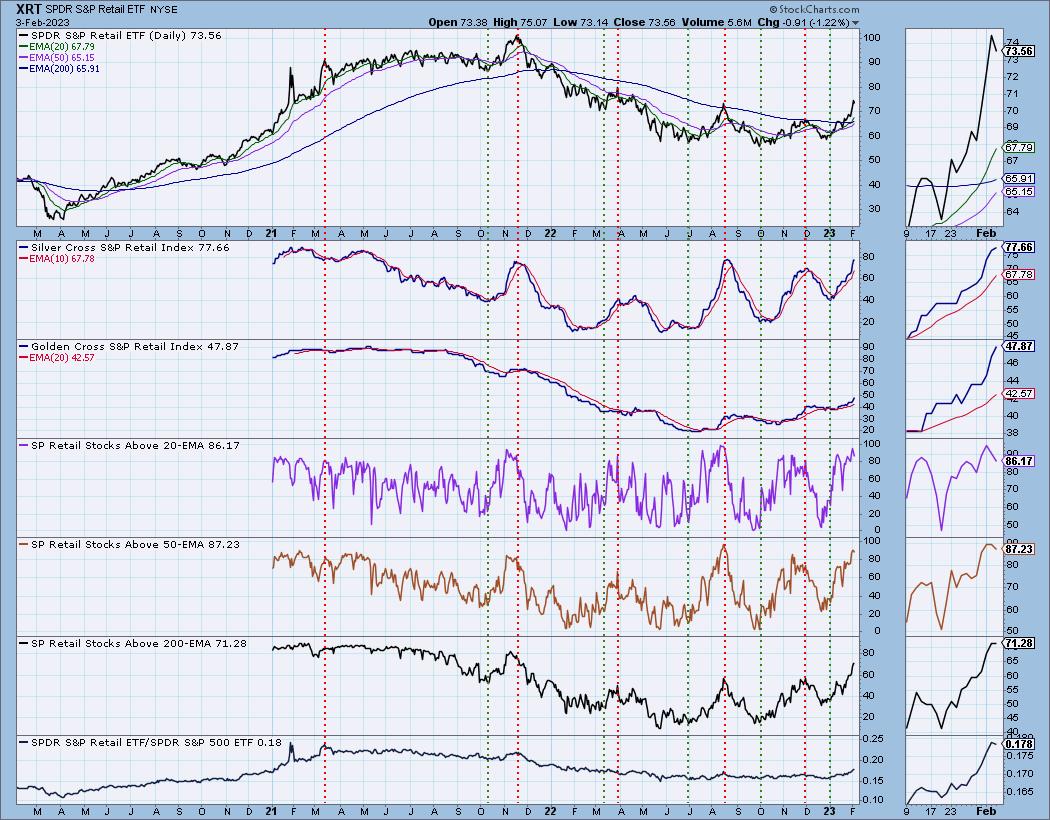
The Silver Cross Index and Golden Cross Index are rising nicely on XRT. Participation is robust. Notice that, when the Silver Cross Index turned up, the relative strength had not begun to rise much. Participation began to improve even before the Silver Cross Index would have gotten us into the rally sooner.
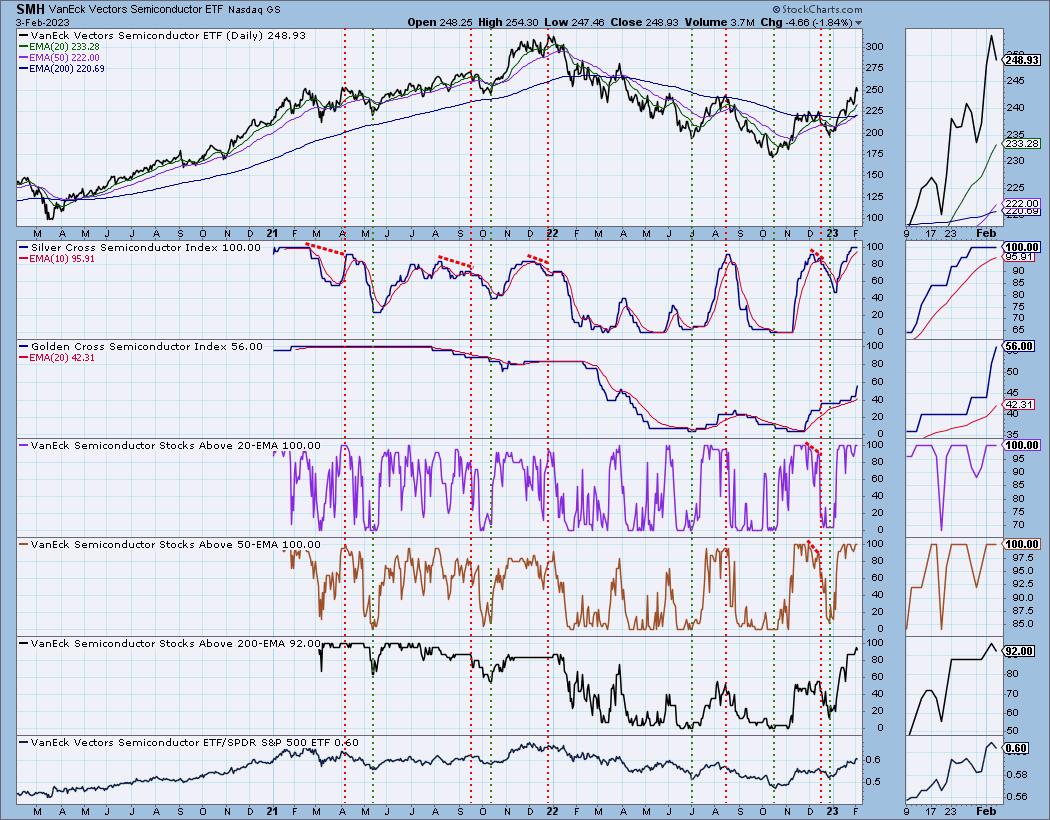
The SMH chart is bit disjointed, mainly because there are fewer members in this industry group ETF. We know this group has shown amazing leadership and, looking at the participation numbers, it's still going strong. Notice we just got a LT Trend Model "Golden Cross" BUY signal on SMH as the 50-day EMA crossed above the 200-day EMA. This is one reason we see the vertical rise in the Golden Cross Index. If the group itself is getting a Golden Cross, the stocks within are likely seeing the same thing. Currently, all of them have price above their 20-/50-day EMAs, and that has pushed the Silver Cross Index to 100% as well. What this tells us is that we should see a rally continuation. As soon as the participation numbers begin to crack, we will be warned.
Conclusion: Adding participation to charts gives you advance notice of internal strength. We now have Golden Cross Indexes and Silver Cross Indexes for all of the major indexes, all sectors, and, now, six industry groups (Gold Miners (GDX), Transportation (IYT) and now Regional Banks (KRE), Semiconductors (SMH), Retail (XRT) and Biotechs (IBB)). These annotated charts are only available for daily review by DecisionPoint.com subscribers.
Want to give us a try? Use coupon code: DPTRIAL2 and get two weeks to check us out for FREE!
Watch the latest episode of DecisionPoint on StockCharts TV's YouTube channel here!

Technical Analysis is a windsock, not a crystal ball. --Carl Swenlin
(c) Copyright 2023 DecisionPoint.com
Helpful DecisionPoint Links:
DecisionPoint Alert Chart List
DecisionPoint Golden Cross/Silver Cross Index Chart List
DecisionPoint Sector Chart List
Price Momentum Oscillator (PMO)
Swenlin Trading Oscillators (STO-B and STO-V)
DecisionPoint is not a registered investment advisor. Investment and trading decisions are solely your responsibility. DecisionPoint newsletters, blogs or website materials should NOT be interpreted as a recommendation or solicitation to buy or sell any security or to take any specific action.


