DecisionPoint April 28, 2023 at 05:07 PM
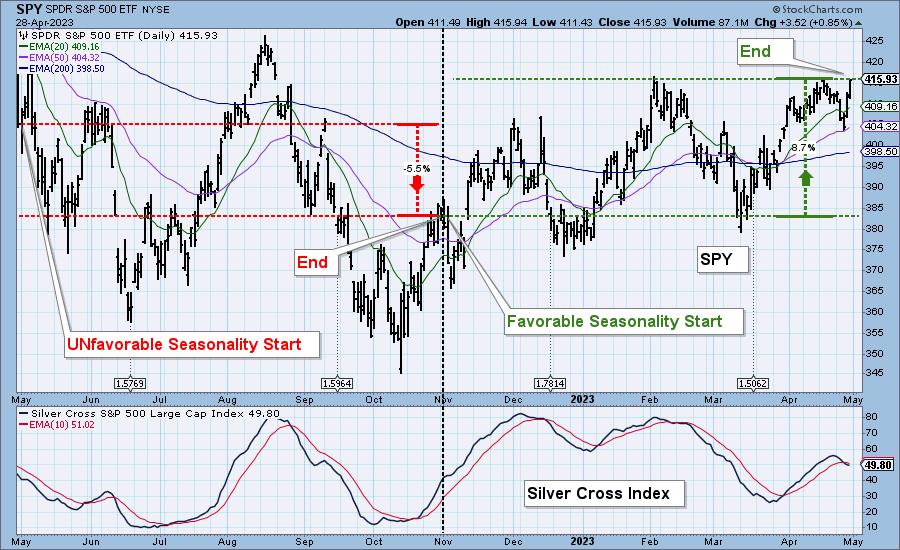
An interesting Seasonality Timing System was developed by Yale Hirsh of the Stock Trader's Almanac. It was based upon the observation that stock market seasonality is broken into two six-month periods. The favorable period begins on November 1 and ends on April 30... Read More
DecisionPoint April 26, 2023 at 06:55 PM
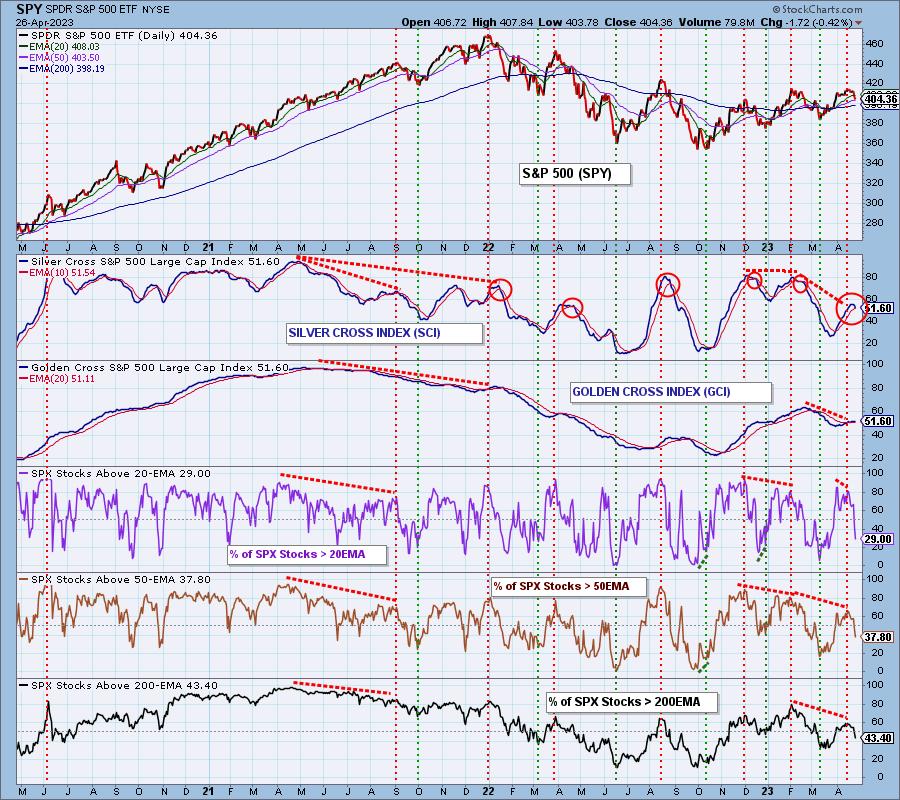
We decided that it was time to come up with a name for Silver Cross Index and Golden Cross Index crossovers their signal lines. We've noticed that Silver Cross Index crossovers are excellent flags to intermediate-term changes in direction... Read More
DecisionPoint April 24, 2023 at 05:31 PM

On this week's edition of The DecisionPoint Trading Room, Carl, as always, opens the show with a market overview, but, in this episode, spends extra time looking at the Dollar in all three timeframes... Read More
DecisionPoint April 20, 2023 at 07:28 PM
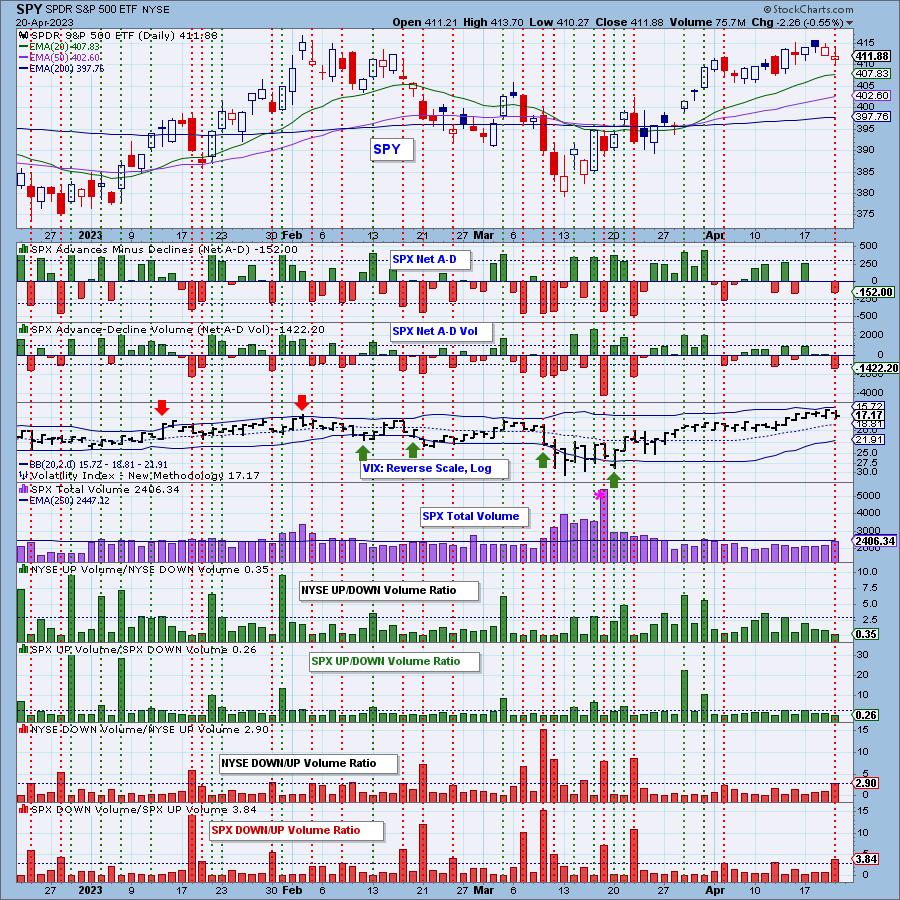
We've been watching and waiting for our IT indicators to turn down in overbought territory, and today they did... Read More
DecisionPoint April 10, 2023 at 05:11 PM
On this week's edition of The DecisionPoint Trading Room, Carl opens with a discussion of Regional Banks and gives us a link to a video that explains the safety of brokerage versus savings account insurance. He also covers why we use relative strength of the SPY v... Read More
DecisionPoint April 03, 2023 at 06:13 PM
On this week's edition of The DecisionPoint Trading Room, Erin presents a review of all of the sectors to find out where new momentum lies and where relative strength is -- you might be surprised... Read More
DecisionPoint April 03, 2023 at 01:54 PM
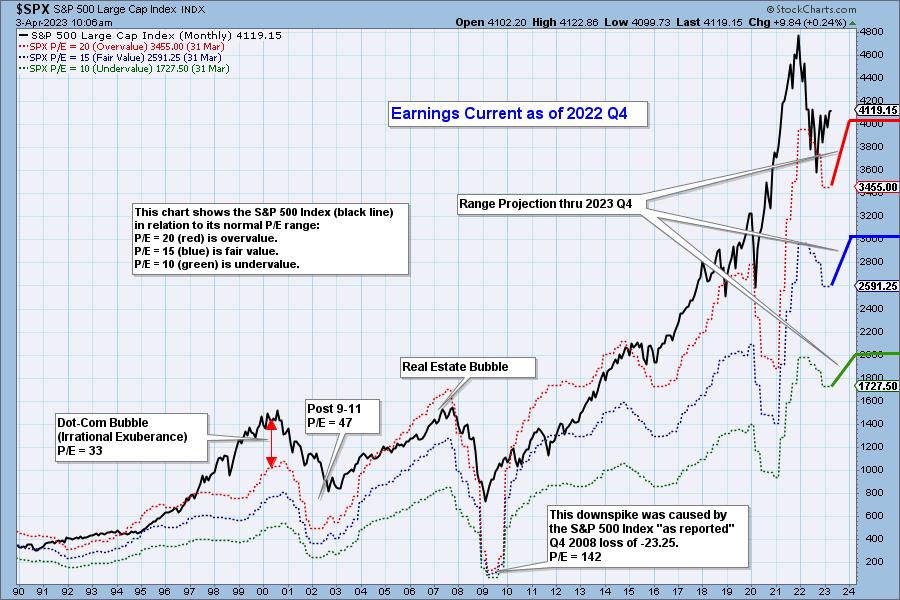
The following chart shows the normal value range of the S&P 500 Index, indicating where the S&P 500 would have to be in order to have an overvalued P/E of 20 (red line), a fairly valued P/E of 15 (blue line), or an undervalued P/E of 10 (green line)... Read More