An interesting Seasonality Timing System was developed by Yale Hirsh of the Stock Trader's Almanac. It was based upon the observation that stock market seasonality is broken into two six-month periods. The favorable period begins on November 1 and ends on April 30. The unfavorable period begins on May 1 and ends on October 31. The rule is that you get fully invested in stocks on November 1, then switch to T-Bills on May 1. ("Sell in May and go away.")
There are various reasons behind seasonality tendencies. For example, summer vacations cause investors to lose interest in the market, resulting in stock prices languishing. For a thorough analysis of this phenomenon, I recommend Riding the Bear, by Sy Harding. On the original DecisionPoint website, we had one-year charts analyzing seasonality all the way back to the 1920s, and I can tell you that the system works sometimes, and sometimes it doesn't. That doesn't mean that we shouldn't have an awareness of the seasonality cycles, because there is clearly something there, and it has tended to work better in "modern times."
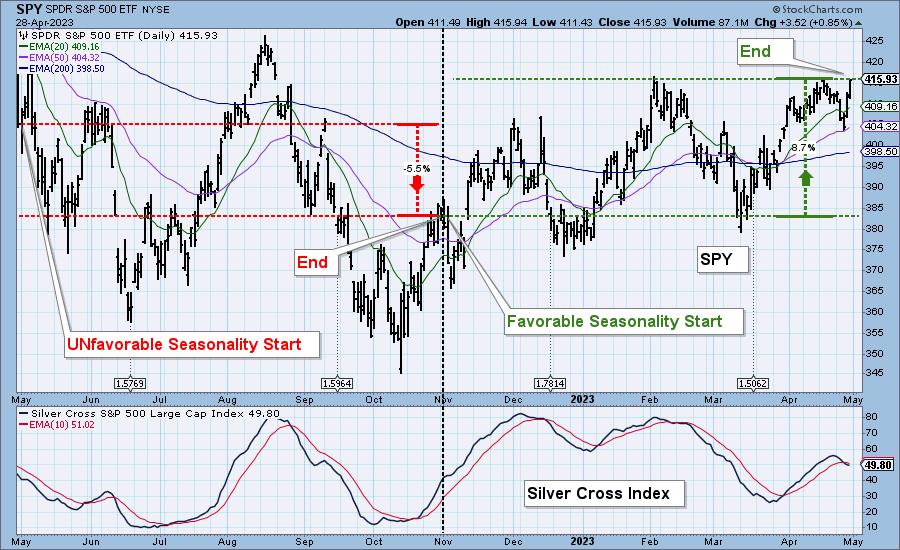
Looking at the most recent one-year period, we can see that both the favorable and unfavorable periods delivered profits on a strictly mechanical basis, but the ride got pretty rough at times. I have added a panel with the Silver Cross Index*, one indicator which could be used to refine entry and exit points, rather than trying to "white-knuckle" it six months at a time.
Conclusion: Having studied this Seasonality Timing System over the years, I have concluded that it is better to throw in a little brain power, rather than making decisions on a strictly by the mechanical basis suggested by the model. With the beginning of the unfavorable period, I will keep in mind that negative seasonality is one thing that will be working against long positions for the next six months, but I will rely primarily on our indicators for our analysis and decision making.
*The Silver Cross Index shows the percentage of stocks in a given index that have the 20-day EMA above the 50-day EMA, which is a bullish sign in the intermediate-term.
Learn more about DecisionPoint.com:
Watch the latest episode of DecisionPoint on StockCharts TV's YouTube channel here!

Technical Analysis is a windsock, not a crystal ball. --Carl Swenlin
(c) Copyright 2023 DecisionPoint.com
Helpful DecisionPoint Links:
DecisionPoint Alert Chart List
DecisionPoint Golden Cross/Silver Cross Index Chart List
DecisionPoint Sector Chart List
Price Momentum Oscillator (PMO)
Swenlin Trading Oscillators (STO-B and STO-V)
DecisionPoint is not a registered investment advisor. Investment and trading decisions are solely your responsibility. DecisionPoint newsletters, blogs or website materials should NOT be interpreted as a recommendation or solicitation to buy or sell any security or to take any specific action.


