Over the weekend, Carl decided to put together the chart below. We often make comparisons between the SPY and its equal-weight sibling, RSP. By determining divergences between the two ETFs, we can see whether the mega-cap stocks are leading the charge or whether a rally is supported by the rest of the index.
Currently we have rising tops on the SPY, but declining tops on RSP. This alone tells us that market participation is far from broad. The Apples of the world are leading the index. And, at this point, those Apples of the world are barely holding the market together right now as the SPY is looking very toppy.
Now let's add the Silver Cross Index (SCI) which in and of itself is equally weighted. Each stock is looked at to see whether it has a "Silver Cross" or not. A Silver Cross is a 20-day EMA moving above the 50-day EMA. Typically those stocks are intermediate-term bullish.
Notice at the previous price top in February, the SCI was reading at about 80%. On this higher price top, only about 55% were on Silver Crosses. That's roughly a 30% decrease in the reading and sets up a massive negative divergence. RSP is confirming the problem as it has a much lower April price top.
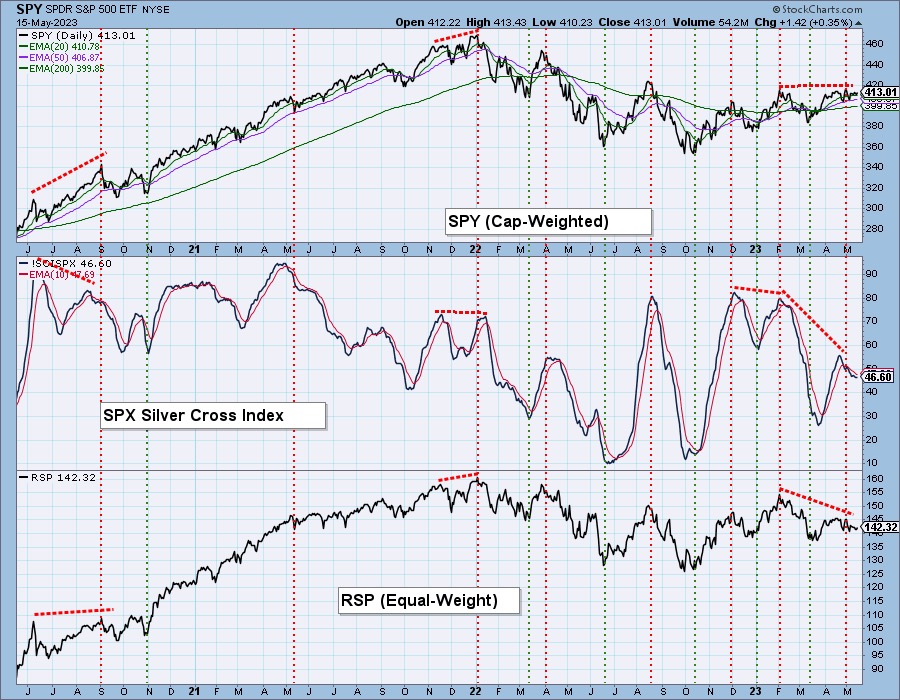
Conclusion: Our question is how is the SPX going to start another bull leg when the rally isn't broad? If the Apples of the world slip, there is no one there to pick up the slack. At this point, we see this as an ominous set up that will likely lead to a severe decline. To see Carl discuss this chart, watch a replay of today's DecisionPoint Trading Room HERE.
Learn more about DecisionPoint.com:
Watch the latest episode of DecisionPoint on StockCharts TV's YouTube channel here!

Technical Analysis is a windsock, not a crystal ball. --Carl Swenlin
(c) Copyright 2023 DecisionPoint.com
Helpful DecisionPoint Links:
DecisionPoint Alert Chart List
DecisionPoint Golden Cross/Silver Cross Index Chart List
DecisionPoint Sector Chart List
Price Momentum Oscillator (PMO)
Swenlin Trading Oscillators (STO-B and STO-V)
DecisionPoint is not a registered investment advisor. Investment and trading decisions are solely your responsibility. DecisionPoint newsletters, blogs or website materials should NOT be interpreted as a recommendation or solicitation to buy or sell any security or to take any specific action.


