Today, we saw broadening of participation by comparing the percentage change of the cap-weighted version of the S&P 500, SPY (+1.50%), versus the equal-weighted, RSP (+2.25%), which shows that today's RSP advanced 52% more than SPY.
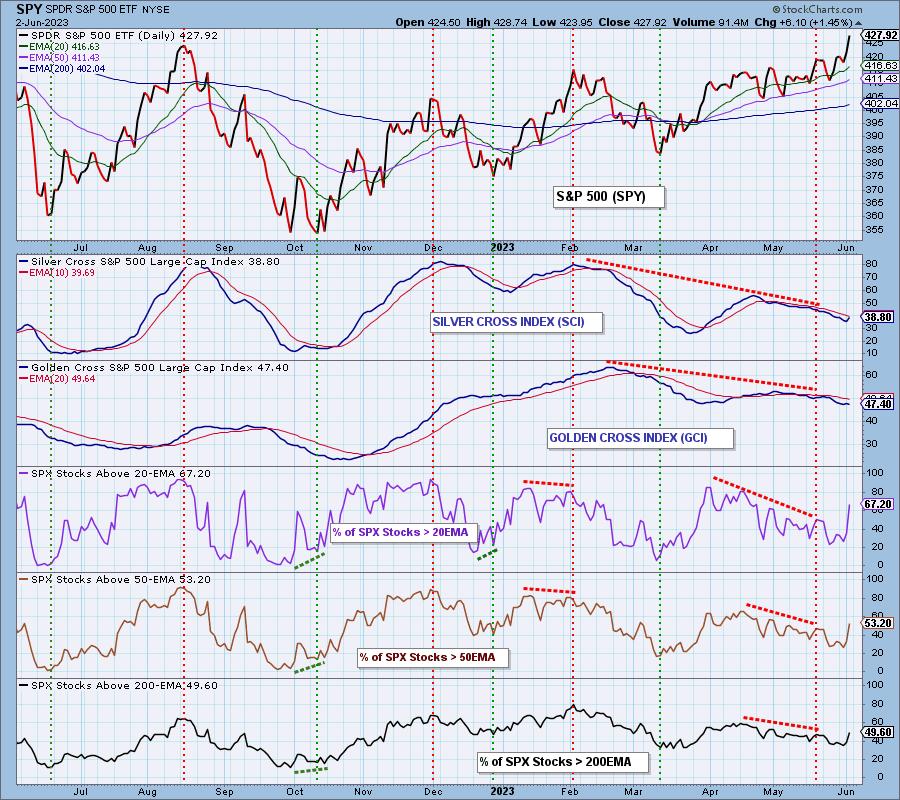
Our biggest beef with the SPY rally was that it wasn't broad. It was narrowed to big mega-cap stocks, and the rest were not participating. Just look at our bias chart below. Notice where the Silver Cross and Golden Cross Indexes were at similar price levels, reading in the 70s and 80s. We're setting a new high, and these indicators show broad participation has been almost nonexistent as they read in the 30s and 40s.
Today saw a big shift as participation of stocks above their 20-/50-/200-day EMAs skyrocketed to and past our 50% bullish threshold.
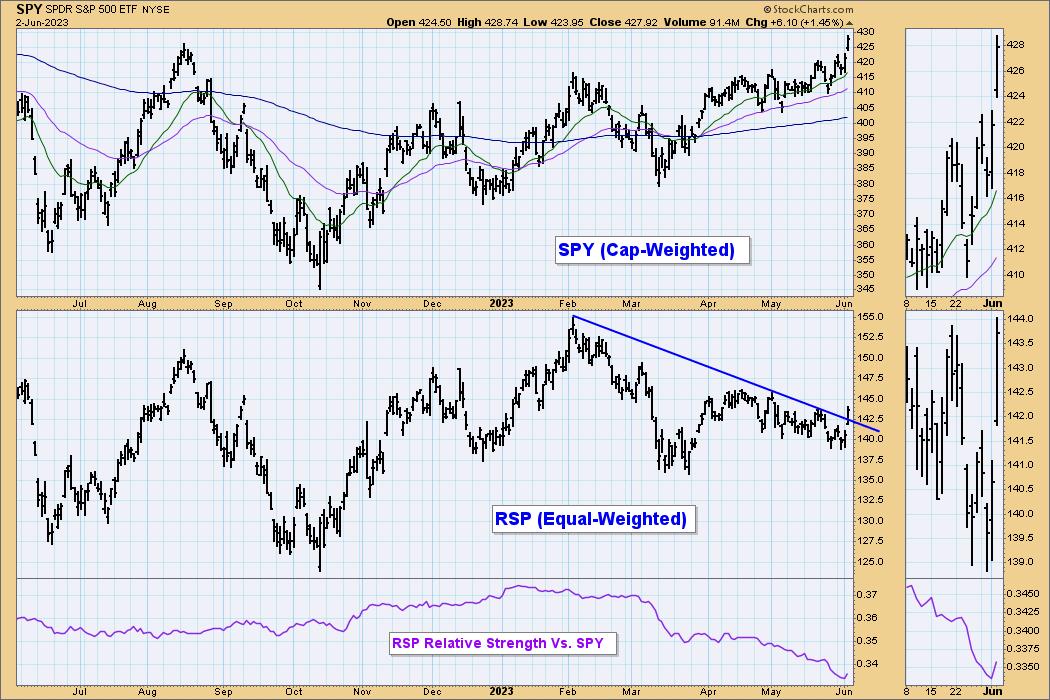
The rally in the SPY has confounded us and, if you look at the comparison between the SPY and RSP, you'll understand why. RSP's price chart is what the SPY should've looked like, but it didn't. Why? The difference is capitalization. It worked in the SPY's favor, but not in RSP's.
RSP's breakout from the declining trend looks good and bolsters the new participation numbers we see on the chart above.
Conclusion: This is only one day's action, but we think it shows a turning point. We've often been asked what it would take for us to move to the bull camp, and we always reply "bias", we need to see the broader market participating. We are seeing that now.
Learn more about DecisionPoint.com:
Watch the latest episode of DecisionPoint on StockCharts TV's YouTube channel here!

Technical Analysis is a windsock, not a crystal ball. --Carl Swenlin
(c) Copyright 2023 DecisionPoint.com
Helpful DecisionPoint Links:
DecisionPoint Alert Chart List
DecisionPoint Golden Cross/Silver Cross Index Chart List
DecisionPoint Sector Chart List
Price Momentum Oscillator (PMO)
Swenlin Trading Oscillators (STO-B and STO-V)
DecisionPoint is not a registered investment advisor. Investment and trading decisions are solely your responsibility. DecisionPoint newsletters, blogs or website materials should NOT be interpreted as a recommendation or solicitation to buy or sell any security or to take any specific action.


