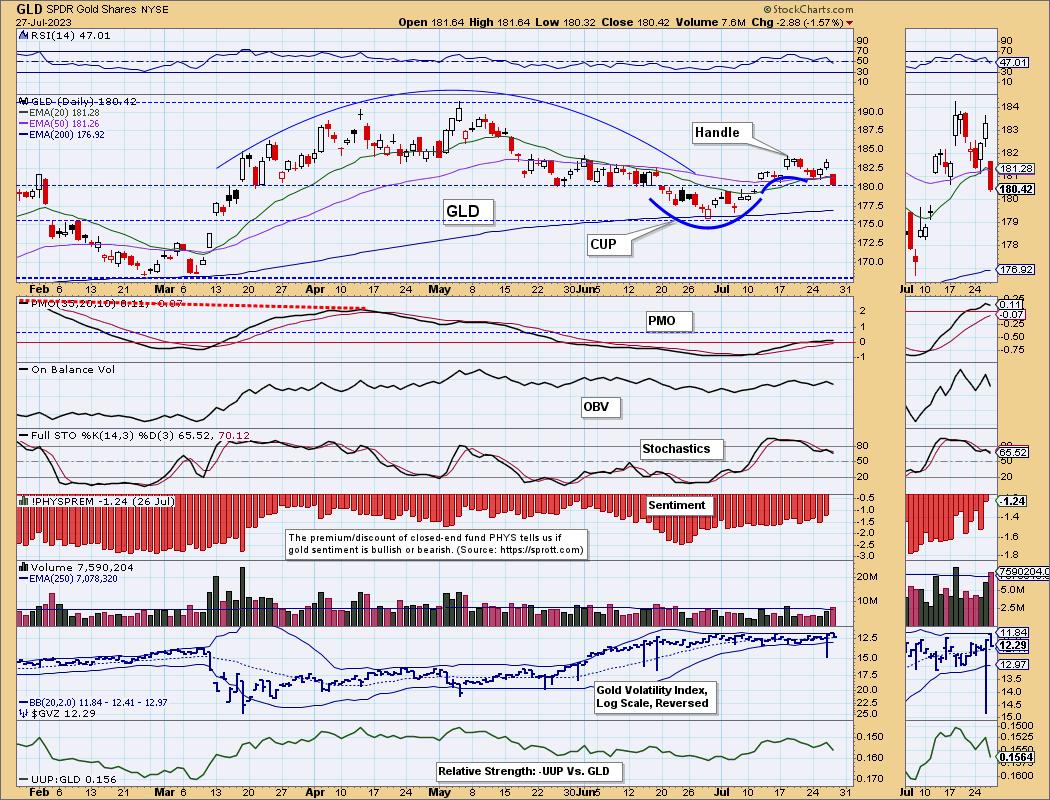
On Wednesday, the SPDR Gold Shares ETF (GLD) 20-day EMA crossed up through the 50-day EMA, generating an IT Trend Model BUY Signal. This means that GLD is bullish in the intermediate-term. GLD was already in a long-term bull market when, in January, the 50-day EMA crossed up through the 200-day EMA. Signal status is as follows:
IT Trend Model: BUY as of 7/26/2023
LT Trend Model: BUY as of 1/5/2023
As of today, GLD declined back below the 20-day and 50-day EMAs, which will result in the new BUY Signal being reversed (probably tomorrow) unless price gets back above them quickly. As I said yesterday, Gold's upward progress is usually tedious at best.
Also on the chart, I have noted a bearish rounded top formation between March and June, but Gold is in a long-term bull market and that formation failed to execute. Currently, we have a bullish cup with handle formation in progress.
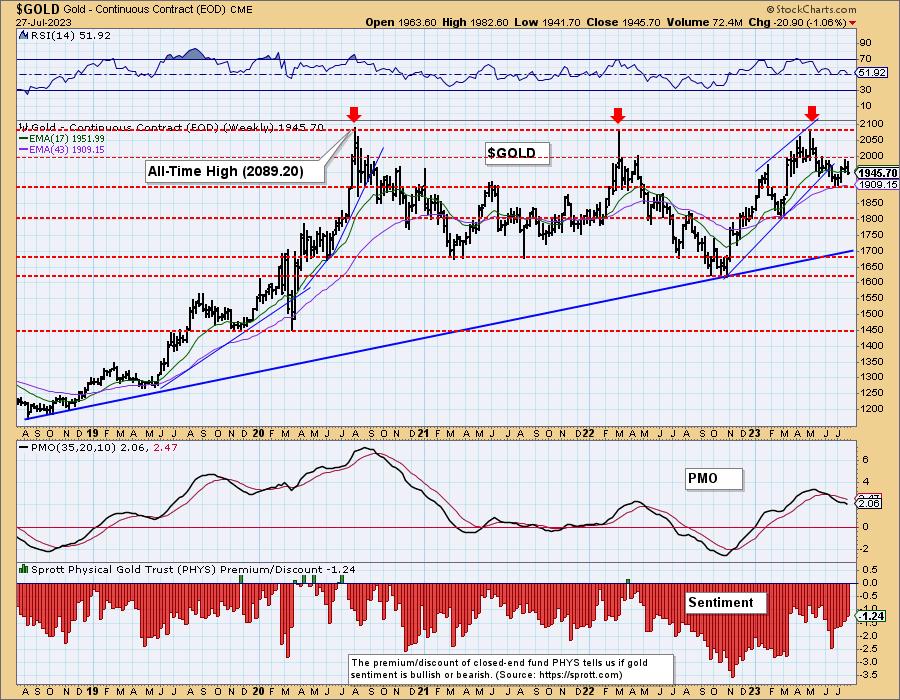
On the weekly chart, we can see that Gold has been turned back by resistance three separate times, but I think the third time may be the charm. The first two attempts were parabolic moves, which are usually doomed to failure. The third advance from the 2022 low has been more deliberate, advancing within a rising trend channel. While it too was turned back, I think there is a good chance of a successful break through this time.
Finally, the monthly chart shows that Gold has been in a trading range for 13 years. That is a bullish continuation pattern. There is also a bullish cup with handle, implying that a long-term breakout is likely.
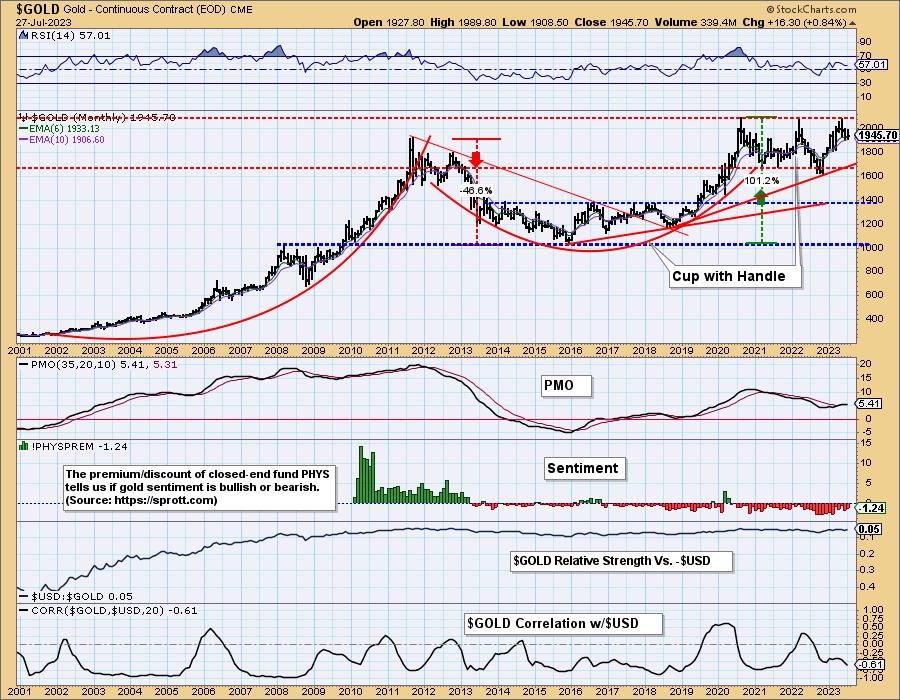
Conclusion: Gold has been doing a lot of long-term work by consolidating the huge advance from the 2001 lows. We think that the most recent attempt to break to new, all-time highs will ultimately be successful, but we may find ourselves grinding our teeth through the process.
Learn more about DecisionPoint.com:
Watch the latest episode of DecisionPoint on StockCharts TV's YouTube channel here!

Technical Analysis is a windsock, not a crystal ball. --Carl Swenlin
(c) Copyright 2023 DecisionPoint.com
Helpful DecisionPoint Links:
DecisionPoint Alert Chart List
DecisionPoint Golden Cross/Silver Cross Index Chart List
DecisionPoint Sector Chart List
Price Momentum Oscillator (PMO)
Swenlin Trading Oscillators (STO-B and STO-V)
DecisionPoint is not a registered investment advisor. Investment and trading decisions are solely your responsibility. DecisionPoint newsletters, blogs or website materials should NOT be interpreted as a recommendation or solicitation to buy or sell any security or to take any specific action.


