The seven mega-tech stocks, known to some as the Magnificent Seven, have had a magnificent advance since late last year, but now we're seeing some weakness, and it is likely that they will be under-performing for a while. Many have been affected by an emerging expectation of miracles from Artificial Intelligence (AI), but these expectations have no specific manifestation at this point in time. More like irrational exuberance, for the time being. Let's look at their charts.
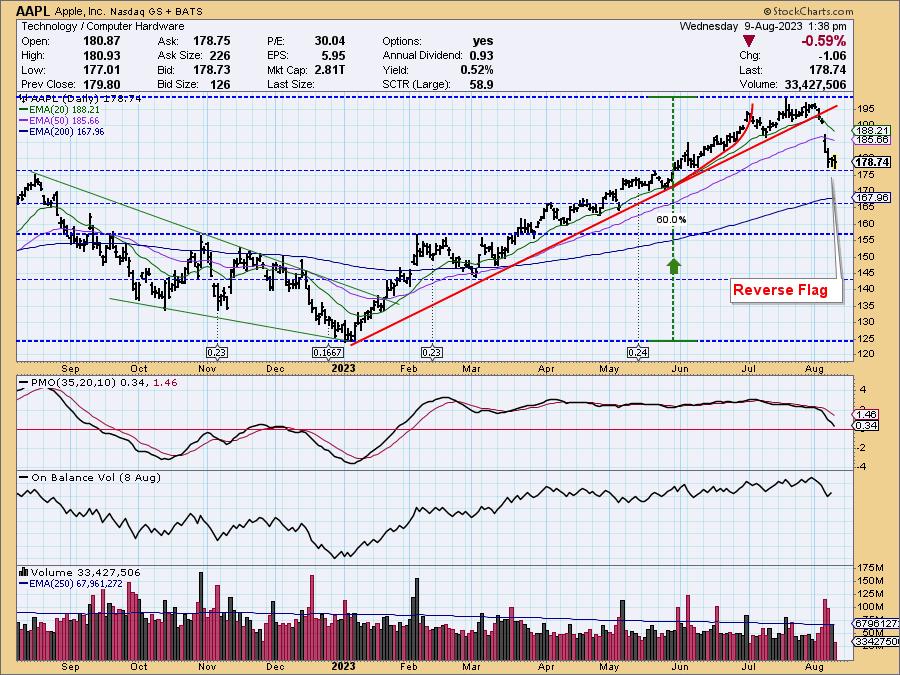
APPLE (AAPL)
Since the price low in early-January, AAPL has maintained an orderly advance until early this month. Then it broke down through the seven-month rising trend line with a vengeance. After an -11% decline, it has paused on obvious support, forming a bearish reverse flag. Our expectation would be for a continued decline.
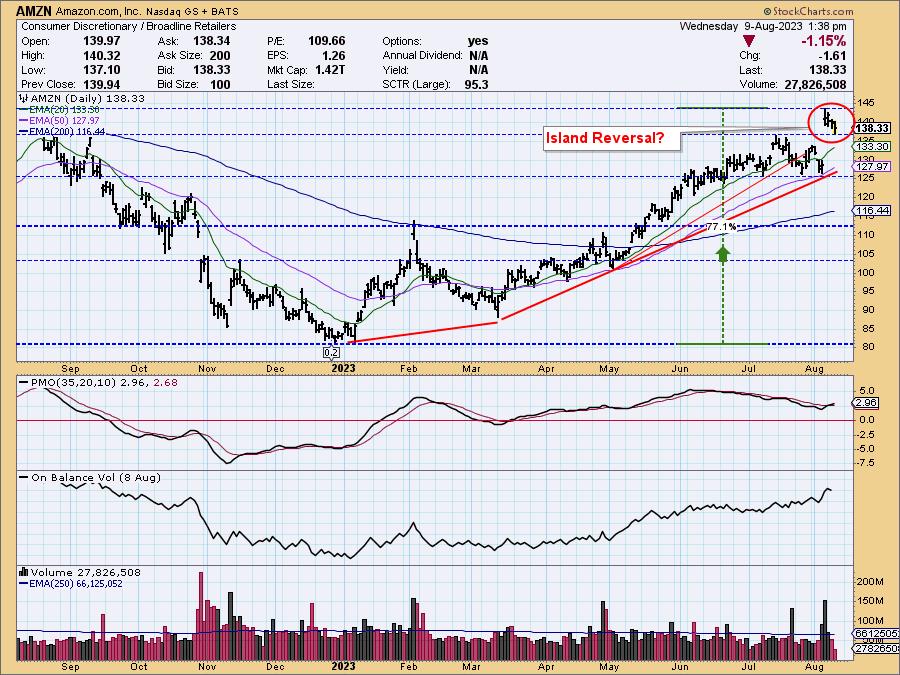
Amazon (AMZN)
AMZN has been advancing since the December price low. In July, it began forming a bearish rounded top, but it gapped up last week on the earnings report. Since then, we have been witnessing a technical pullback. Currently, we see the recent price cluster as possibly being a setup for an island reversal, which would result in price gapping back down to horizontal support at about 125.
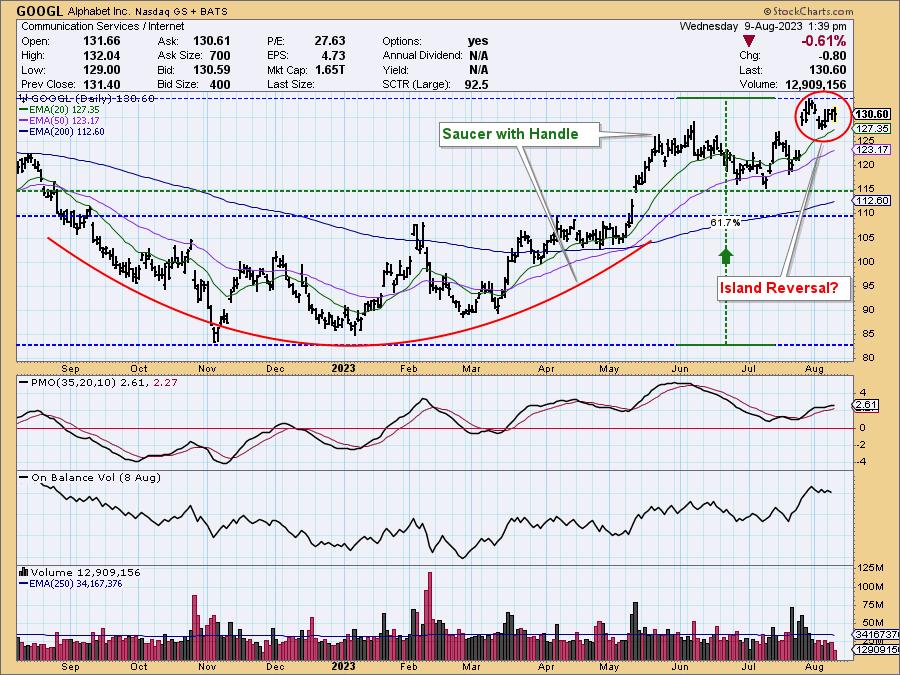
Alphabet, Inc. (GOOGL)
GOOGL made a low in November, before beginning a gradual advance, which resulted in the formation of a saucer. It gapped up and out of that saucer in May and began forming a handle on the saucer in June and July. In late July, it gapped up again and has since been forming its own island formation, which, of course, has the potential to reverse and gap down.
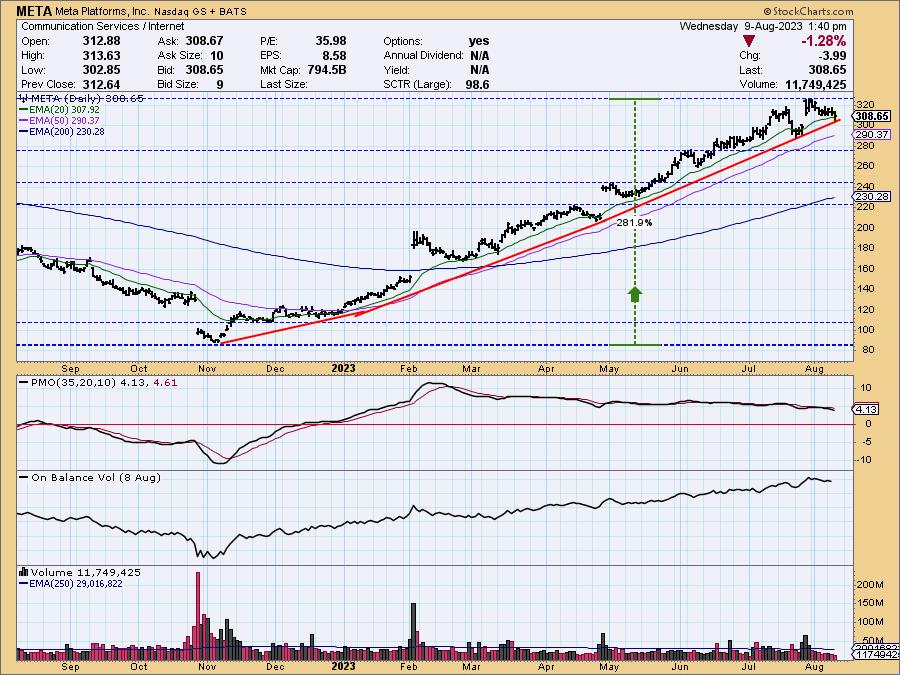
Meta Platforms, Inc. (META)
META hit a bear market bottom in November, then entered an orderly and profitable advance. At this writing, the rising trend is still intact, but with technology stocks currently in correction, we would expect that META will follow suit. The first line of support is just below 280, and the next just above 240.
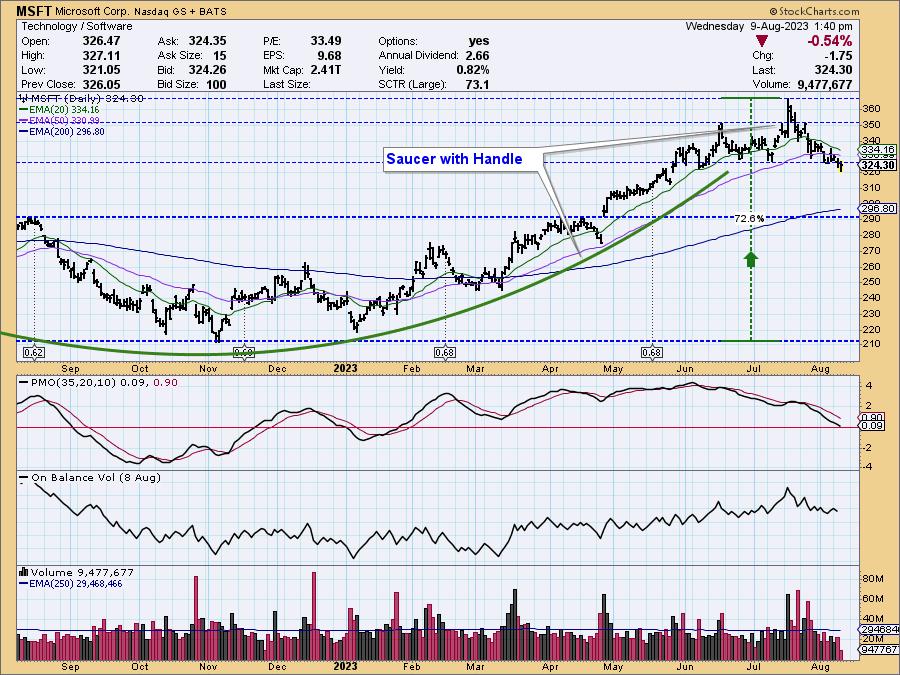
Microsoft (MSFT)
MSFT bottomed in November and has since been forming the right side of a saucer formation. In June, it began moving sideways, forming a handle on the saucer. This is a bullish formation, but there is some potential downside as the handle is formed--maybe down to 290?
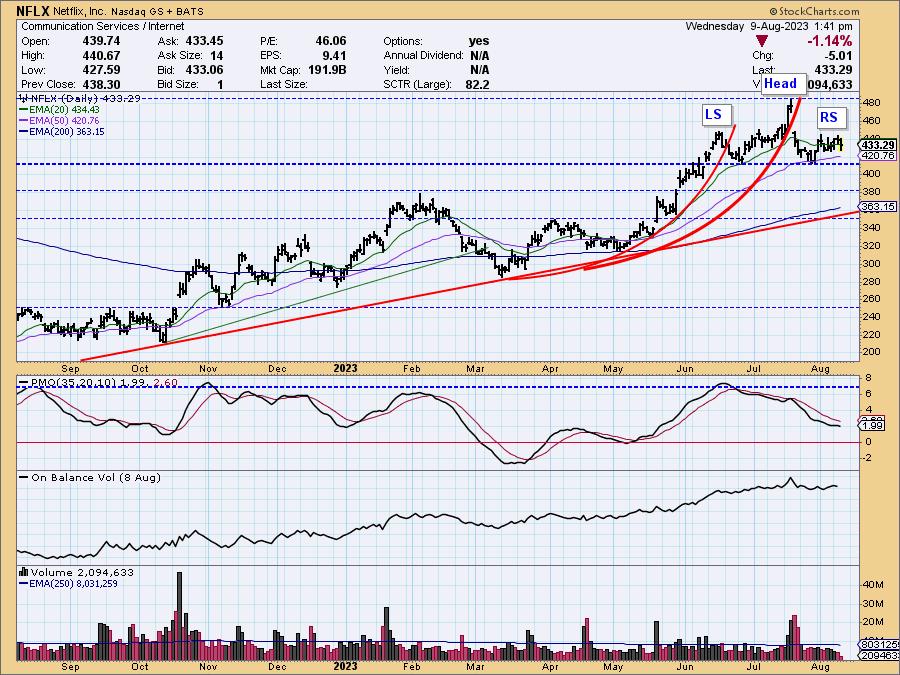
Netflix (NFLX)
NFLX bottomed over a period of three months last summer (not shown) and has since had a somewhat choppy, but persistent, advance. The two "swoosh" marks emphasize how corrections tend to follow advances that become too vertical. The relevant feature at present is a head-and-shoulders formation with a neckline drawn across the two lows. If the formation executes (price drops below the neckline), the minimum downside projection is about 350.
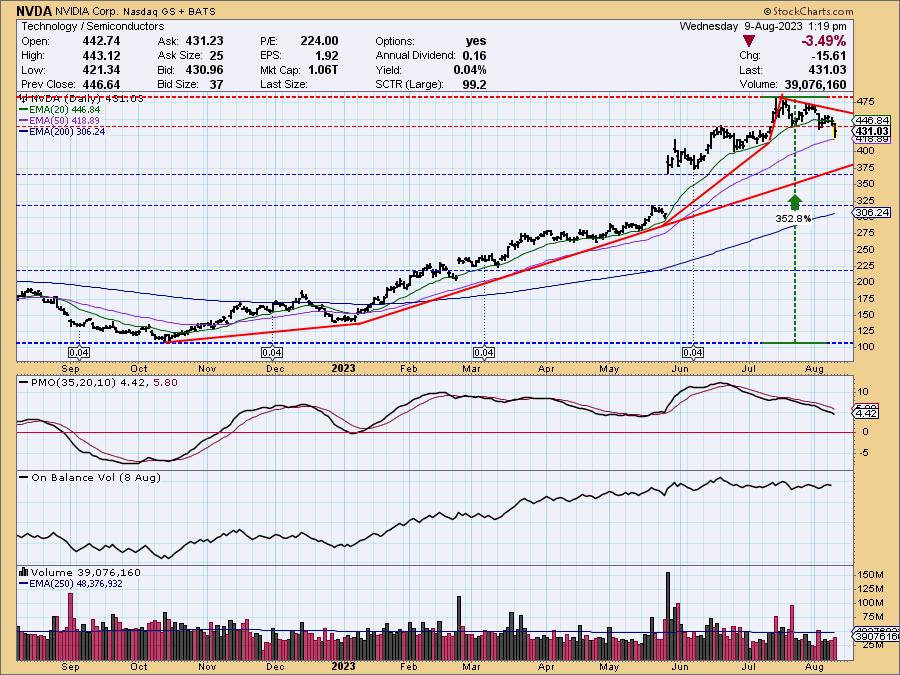
Nvidia (NVDA)
NVDA was the company that benefited most from AI fantasies with a mighty up gap in May. Since the July top, it has been giving back some of its gains, and it is currently in a declining trend. A reasonable downside projection would be down to the top of the gap around 360-ish, which would be a decline of about -25%.
CONCLUSION: The technology sector has gone into correction, and most of the big tech stocks are feeling some of the heat. Of those not yet correcting, we think it likely that they will also succumb soon.
--Carl Swenlin
Learn more about DecisionPoint.com:
Watch the latest episode of DecisionPoint on StockCharts TV's YouTube channel here!

Technical Analysis is a windsock, not a crystal ball. --Carl Swenlin
(c) Copyright 2023 DecisionPoint.com
Helpful DecisionPoint Links:
DecisionPoint Alert Chart List
DecisionPoint Golden Cross/Silver Cross Index Chart List
DecisionPoint Sector Chart List
Price Momentum Oscillator (PMO)
Swenlin Trading Oscillators (STO-B and STO-V)
DecisionPoint is not a registered investment advisor. Investment and trading decisions are solely your responsibility. DecisionPoint newsletters, blogs or website materials should NOT be interpreted as a recommendation or solicitation to buy or sell any security or to take any specific action.


