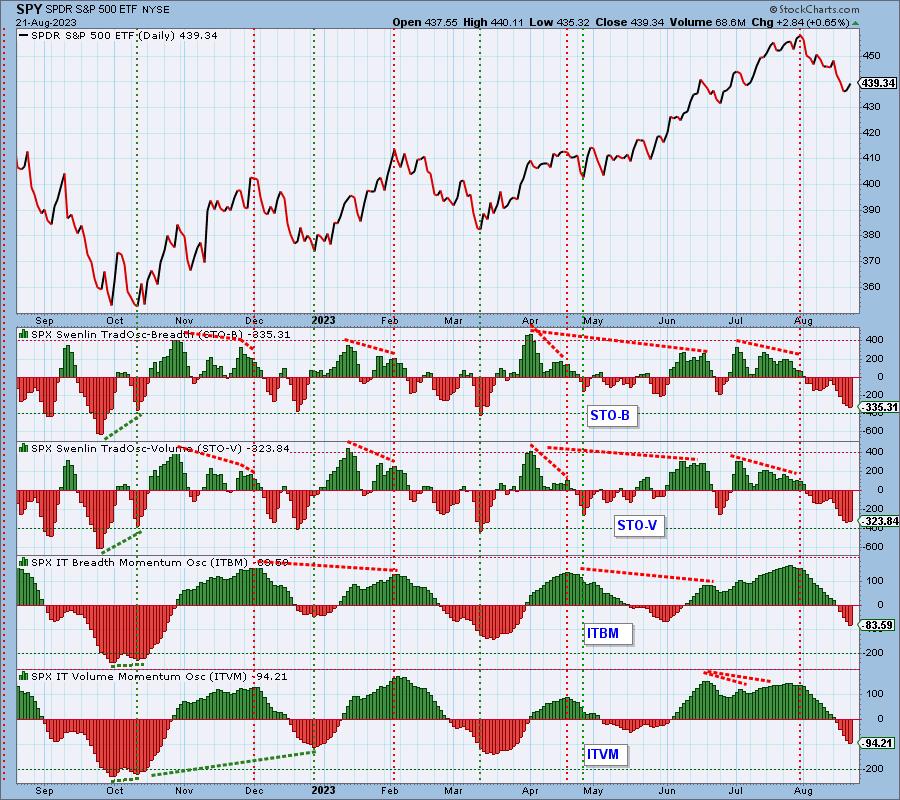
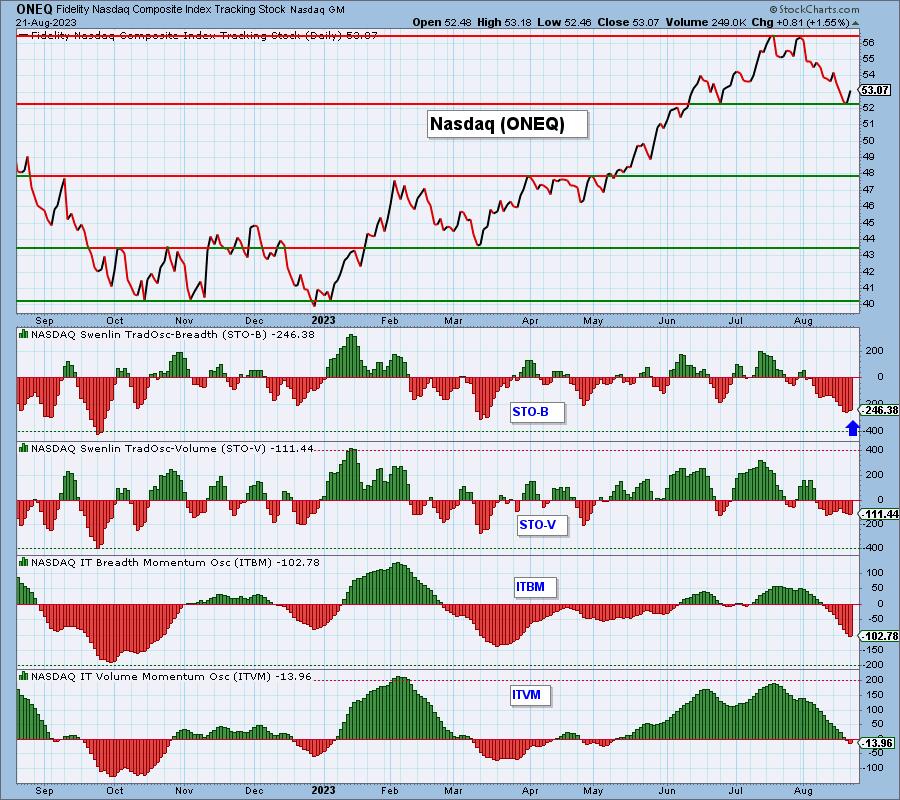
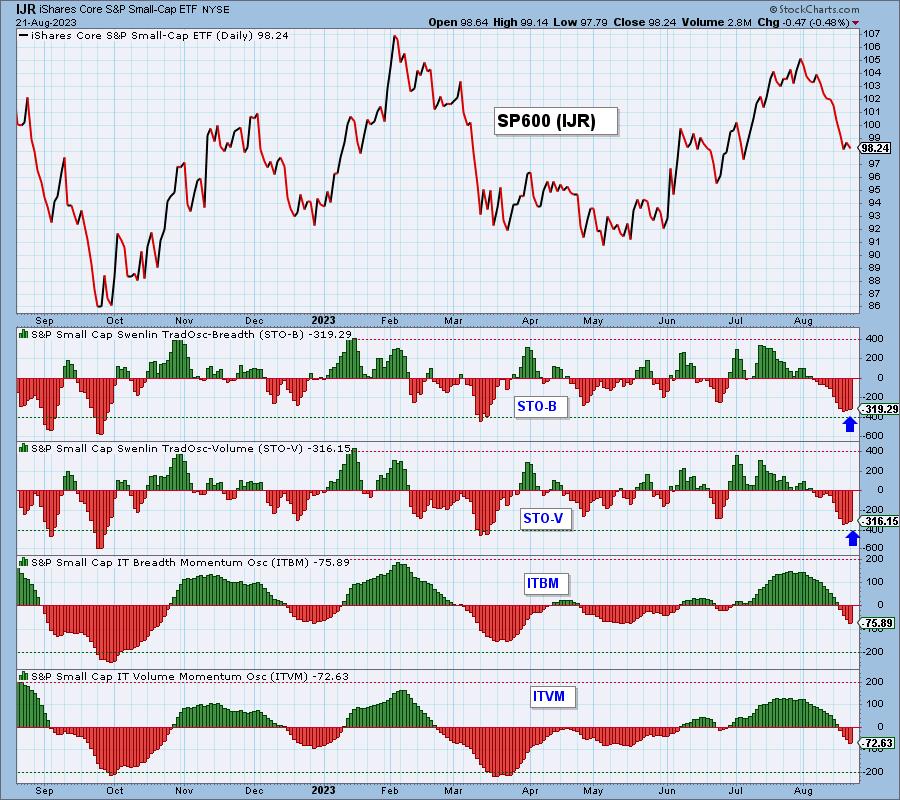
It was ultimately a decent rally today on the SP500 with help from the tech heavy Nasdaq. Swenlin Trading Oscillators (STOs) are our primary short-term indicators. They have been in decline for all of the indexes, but we noted a few trying to turn up. The SPY saw a rise in the Swenlin Trading Oscillator for volume (STO-V), but not the Swenlin Trading Oscillator for Breadth (STO-B). The Nasdaq (ONEQ) saw the opposite with the STO-B rising, but STO-V still falling. Both have turned up for the SP600 (IJR).
As noted above, only the STO-V turned up for the SPY, but another rally will likely push the STO-V up as well. The intermediate-term ITBM and ITVM are not confirming this short-term bullish condition on the STO-B.
August Summer Sale is On!
Buy One Month and Get One Month FREE!
No coupon code is required. Sale ENDS August 31st! No exceptions!
All other major indexes with the exception of the Nasdaq and SP600 continue to see lower readings. It isn't completely surprising to see the Nasdaq improving given the rally today. However, only the STO-B turned up on the Nasdaq. Notice that all the other indicators remain in decline.
We were asked today in the DecisionPoint Trading Room about STOs for the small-caps. The SP600 (IJR) actually looks healthier than both the Nasdaq and SPY given its Swenlin Trading Oscillators began turning up on Friday. We still don't have confirmation from our intermediate-term indicators, but this is a very interesting development, particularly given the lackluster performance today. Again, no confirmation by the ITBM and ITVM to be seen.
Conclusion: Our primary short-term indicators (STOs) are beginning to show a few signs of life. Seeing the broader SP600 improvement under the surface is encouraging for the rest of the market. We would caution this is early and our sense is that we are about to see a pause in the decline, particularly given the NYSE isn't showing signs of improvement.
Learn more about DecisionPoint.com:
Watch the latest episode of DecisionPoint on StockCharts TV's YouTube channel here!

Try us out for two weeks with a trial subscription!
Use coupon code: DPTRIAL2 at checkout!
Technical Analysis is a windsock, not a crystal ball. --Carl Swenlin
(c) Copyright 2023 DecisionPoint.com
Helpful DecisionPoint Links:
DecisionPoint Alert Chart List
DecisionPoint Golden Cross/Silver Cross Index Chart List
DecisionPoint Sector Chart List
Price Momentum Oscillator (PMO)
Swenlin Trading Oscillators (STO-B and STO-V)
DecisionPoint is not a registered investment advisor. Investment and trading decisions are solely your responsibility. DecisionPoint newsletters, blogs or website materials should NOT be interpreted as a recommendation or solicitation to buy or sell any security or to take any specific action.
