Many of the forecasts I hear regarding bonds seem to be based upon what bonds have done for most of the last 40 years, without acknowledging what has happened more recently. The chart below shows that 30-Year T-Bonds were in a rising trend from the 1982 low, but, in early 2020, they made a long-term top and began trending downward. That downtrend lasted long enough for price to violate the rising trend line, which is strong evidence that the long-term trend has now shifted downward. Technically, we should expect that this downtrend will continue for a long time, probably decades.
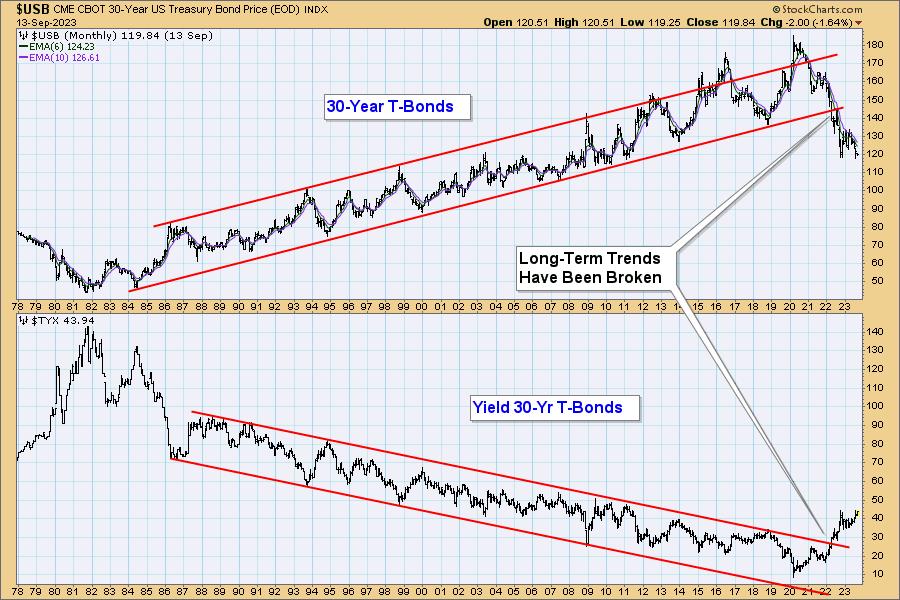
The problem with long-term charts is that we get to review huge segments of time without experiencing the tedium of the normal real-time market ebb and flow. For example, while the price trend from 1982 was primarily up, there were periods of a year or more when price moved down or sideways, so in spite of the dominant downtrend, it is likely that bonds will rally soon, and that the rally may last for quite a while. When that happens, I caution against assuming that the long-term trend is changing to up. Maybe it is, but it probably isn't.
Conclusion: It is hard for people to abandon investment techniques that have mostly worked for 40 years, but it is clear that the paradigm has shifted, and that a new approach is necessary.
Learn more about DecisionPoint.com:
Watch the latest episode of DecisionPoint on StockCharts TV's YouTube channel here!

Try us out for two weeks with a trial subscription!
Use coupon code: DPTRIAL2 at checkout!
Technical Analysis is a windsock, not a crystal ball. --Carl Swenlin
(c) Copyright 2023 DecisionPoint.com
Disclaimer: This blog is for educational purposes only and should not be construed as financial advice. The ideas and strategies should never be used without first assessing your own personal and financial situation, or without consulting a financial professional. Any opinions expressed herein are solely those of the author, and do not in any way represent the views or opinions of any other person or entity.
DecisionPoint is not a registered investment advisor. Investment and trading decisions are solely your responsibility. DecisionPoint newsletters, blogs or website materials should NOT be interpreted as a recommendation or solicitation to buy or sell any security or to take any specific action.
Helpful DecisionPoint Links:
DecisionPoint Alert Chart List
DecisionPoint Golden Cross/Silver Cross Index Chart List
DecisionPoint Sector Chart List
Price Momentum Oscillator (PMO)
Swenlin Trading Oscillators (STO-B and STO-V)


