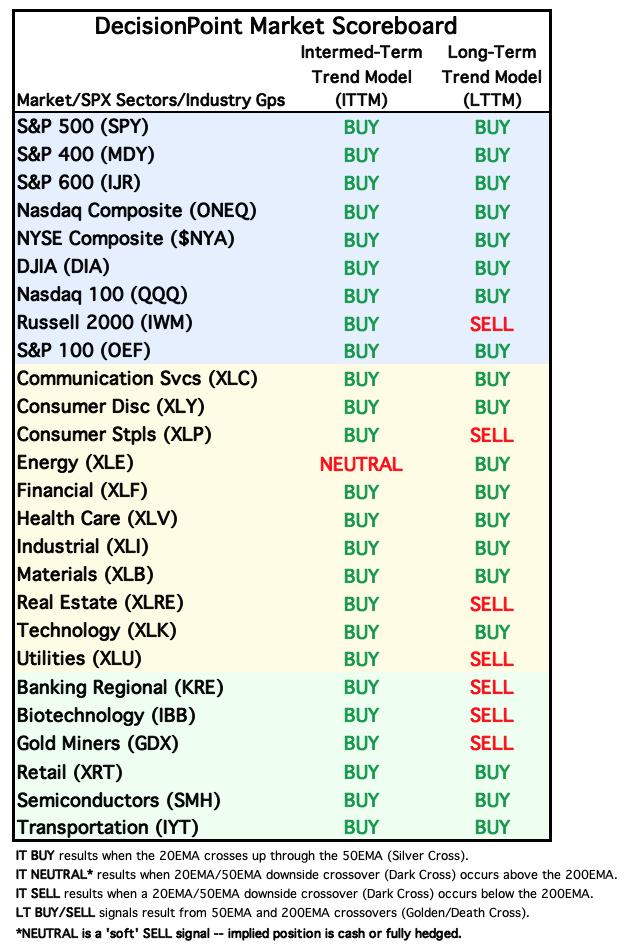
We publish this table daily to give an overview of the market, sector, and industry group indexes we follow. The Intermediate-Term Trend Model (ITTM) BUY Signals occur when the 20-day EMA crosses up through the 50-day EMA (Silver Cross). Long-Term Trend Model (LTTM) BUY Signals occur when the 50-day EMA crosses up through the 200-day EMA (Golden Cross).
Obviously, the intermediate-term status is excellent, with all but the Energy Sector on ITTM BUY Signals.
Let's take a look at the Energy Sector chart. Energy has been in a downtrend since the September top, and it has held little promise until today, when commodities in general, and crude oil in particular, had solid rallies. It is a little early to declare victory for Energy, but it's a good start.
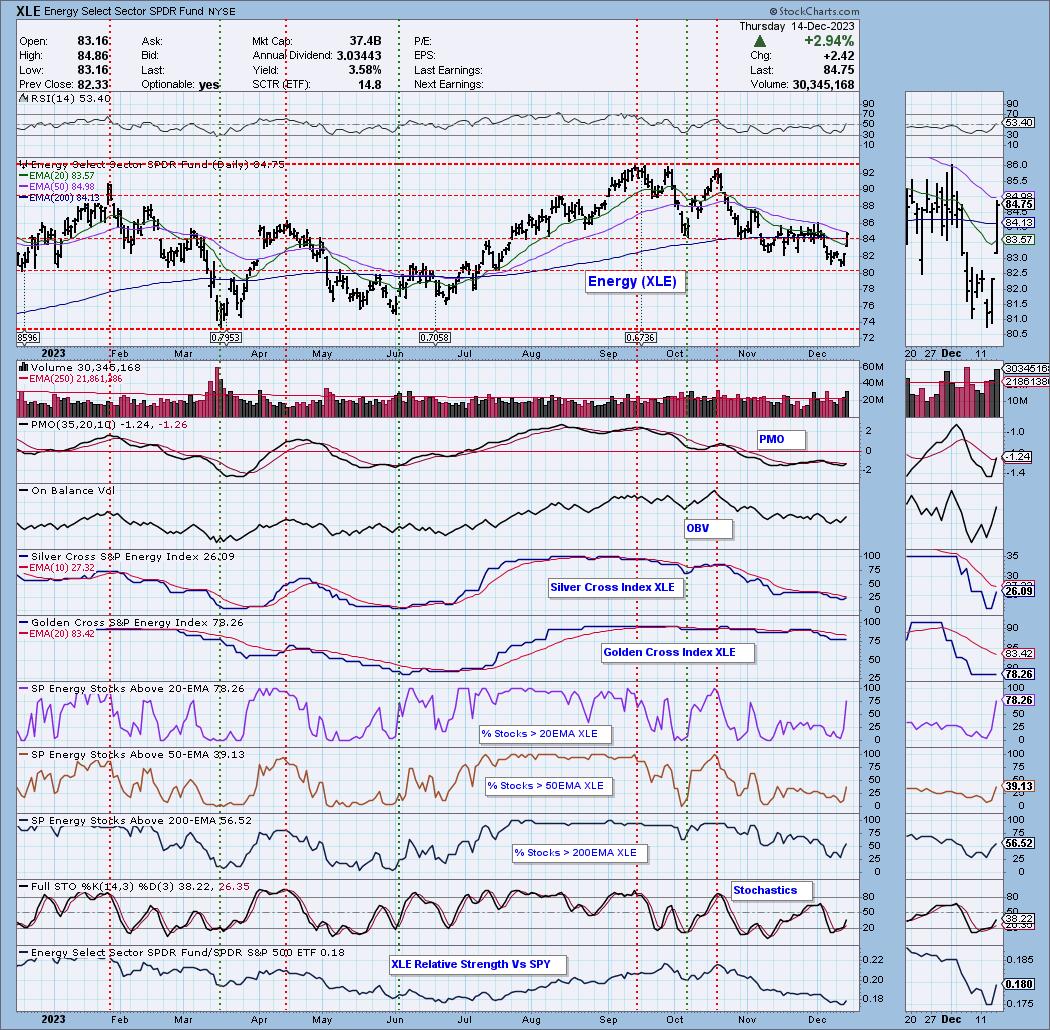
Digging deeper into the technicals, we note that the Silver Cross Index (the percent of XLE components that have their 20-EMA above their 50-EMA) is very depressed and is due a turnaround. The Golden Cross Index (the percent of XLE components that have their 50-EMA above their 200-EMA) is still very strong, and should underwrite intermediate-term improvement.
Conclusion: While Energy has been poor for the last few months, it appears that rapid improvement is about to take place.
Learn more about DecisionPoint.com:
Watch the latest episode of DecisionPoint on StockCharts TV's YouTube channel here!

Try us out for two weeks with a trial subscription!
Use coupon code: DPTRIAL2 at checkout!
Technical Analysis is a windsock, not a crystal ball. --Carl Swenlin
(c) Copyright 2023 DecisionPoint.com
Disclaimer: This blog is for educational purposes only and should not be construed as financial advice. The ideas and strategies should never be used without first assessing your own personal and financial situation, or without consulting a financial professional. Any opinions expressed herein are solely those of the author, and do not in any way represent the views or opinions of any other person or entity.
DecisionPoint is not a registered investment advisor. Investment and trading decisions are solely your responsibility. DecisionPoint newsletters, blogs or website materials should NOT be interpreted as a recommendation or solicitation to buy or sell any security or to take any specific action.
Helpful DecisionPoint Links:
DecisionPoint Alert Chart List
DecisionPoint Golden Cross/Silver Cross Index Chart List
DecisionPoint Sector Chart List
Price Momentum Oscillator (PMO)
Swenlin Trading Oscillators (STO-B and STO-V)


