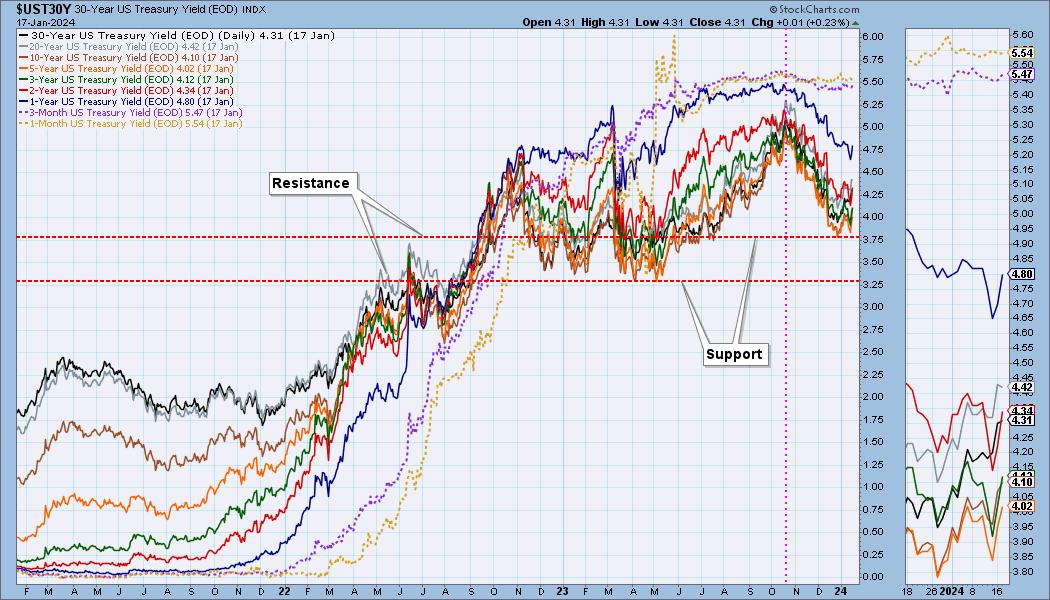
The Fed stopped raising rates in July, and, by mid-October, yields had peaked. Since then, yields have begun to decline in anticipation of the Fed beginning rate cuts this year. At this point, it appears that yields have found support and may possibly bounce, or begin moving sideways. This chart is a little dense, so let's try and clarify the technicals.
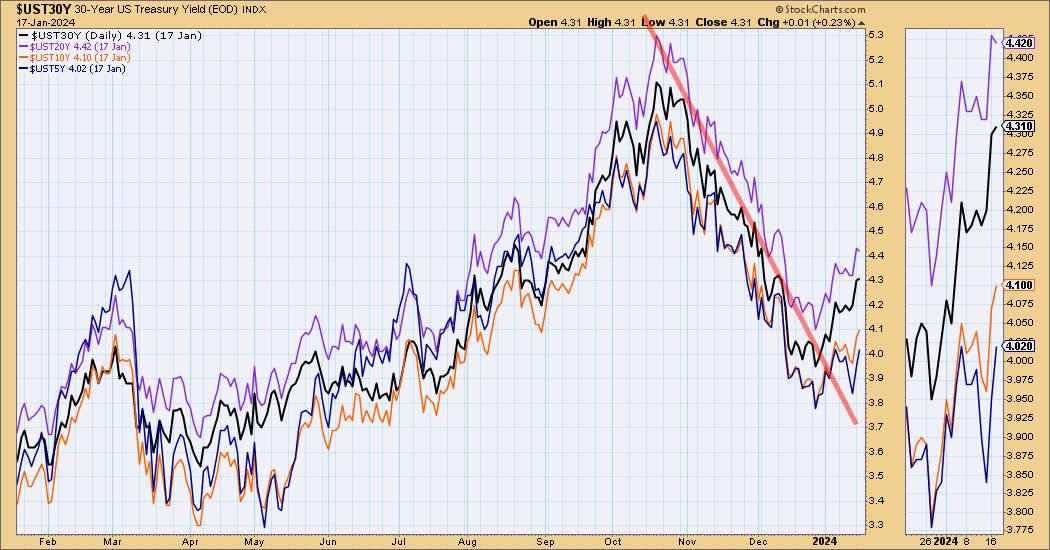
The next chart shows durations of five years or longer. Clearly, they have broken out of the three-month declining trend, so we anticipate that they will trend higher for a while.
Learn more about DecisionPoint.com:
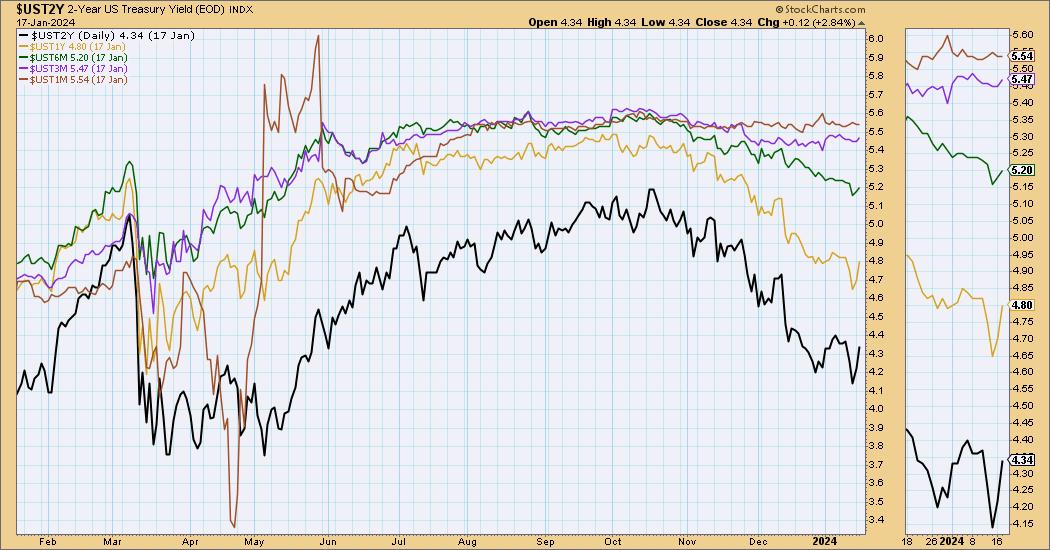
By comparison, shorter duration yields, two years and lower, present a much different picture. First, the very shortest durations, one month to three months, have not declined much at all. This accounts for the increased inversion between long and short duration yields. Additionally, while the one- and two-year yields have pulled back somewhat, they have not broken out of their declining trends yet. This will probably change as the longer-duration yields continue to advance.
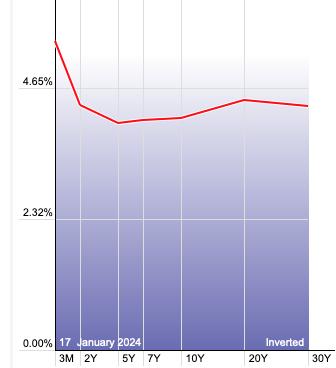
The Dynamic Yield Curve chart on StockCharts.com shows the severity of the yield inversion that currently exists. This should be abated somewhat as longer-duration yields rise, but currently we have no expectation that the inversion will go away.
Conclusion: Yields have been declining for about three months, but most of the decline is concentrated in durations of five years and longer. This will alleviate some of the short versus long duration inversion that exists, but it is not likely to erase it. Significantly, the longer duration yields have broken their declining trends and will probably trend higher until rate cut fever returns.
Watch the latest episode of DecisionPoint on StockCharts TV's YouTube channel here!

Try us out for two weeks with a trial subscription!
Use coupon code: DPTRIAL2 at checkout!
Technical Analysis is a windsock, not a crystal ball. --Carl Swenlin
(c) Copyright 2024 DecisionPoint.com
Disclaimer: This blog is for educational purposes only and should not be construed as financial advice. The ideas and strategies should never be used without first assessing your own personal and financial situation, or without consulting a financial professional. Any opinions expressed herein are solely those of the author, and do not in any way represent the views or opinions of any other person or entity.
DecisionPoint is not a registered investment advisor. Investment and trading decisions are solely your responsibility. DecisionPoint newsletters, blogs or website materials should NOT be interpreted as a recommendation or solicitation to buy or sell any security or to take any specific action.
Helpful DecisionPoint Links:
DecisionPoint Alert Chart List
DecisionPoint Golden Cross/Silver Cross Index Chart List
DecisionPoint Sector Chart List
Price Momentum Oscillator (PMO)
Swenlin Trading Oscillators (STO-B and STO-V)


