We've begun talking more about the Price Momentum Oscillator (PMO) as it relates to finding "pure strength" and "pure weakness". What it all comes down to is the zero line and the PMO's behavior above or below.
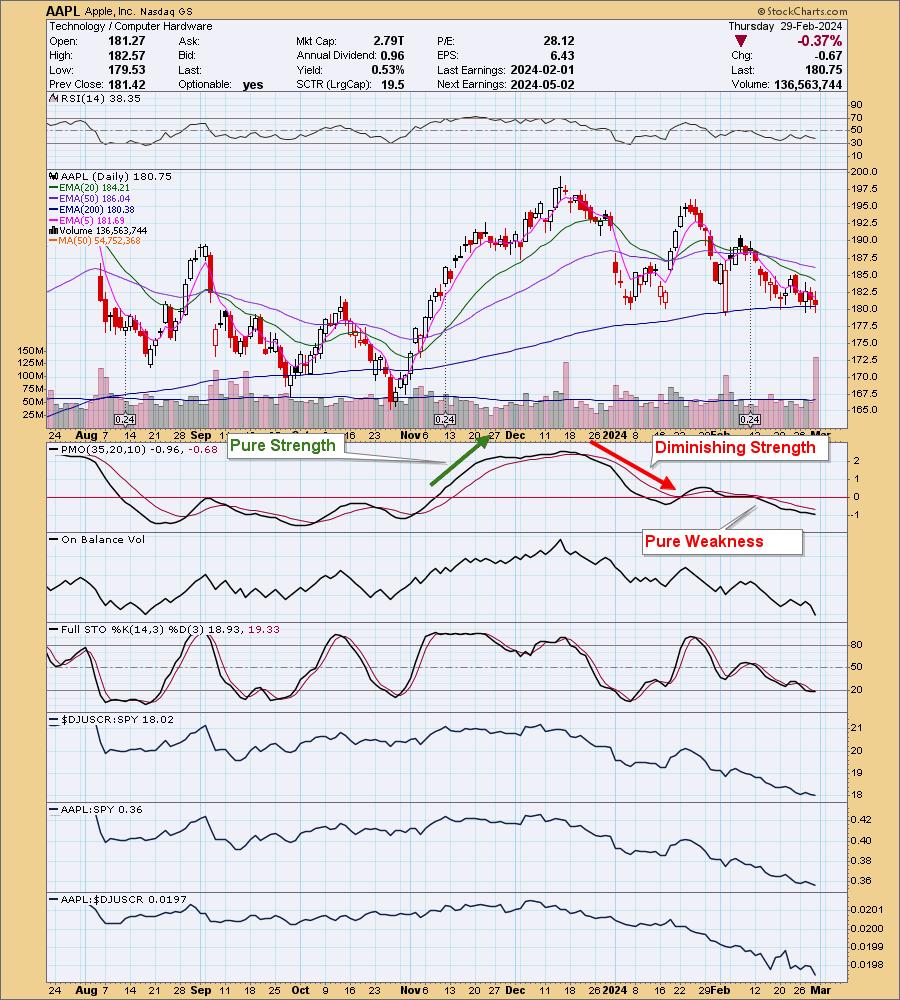
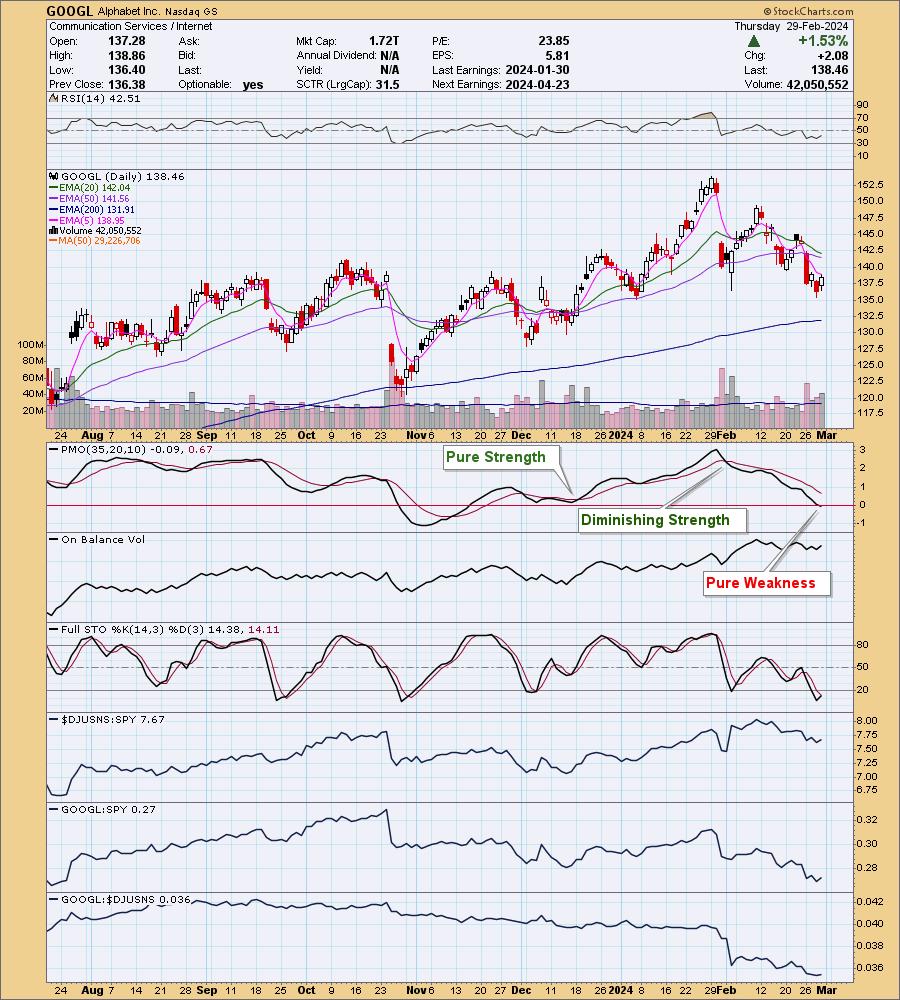
We review the Magnificent 7 charts frequently and we noticed that both Apple (AAPL) and Google (GOOGL) are displaying "pure weakness," as far as the PMO is concerned. Pure weakness is defined by the PMO moving lower or moving sideways below the zero line. The distance the PMO is away from the zero line determines the veracity of the condition.
We can see with AAPL, there was a period of "pure strength" back in November. The PMO had moved above the signal line and was rising strongly. When it topped and began to fall above the zero line, it was a sign of diminishing strength. Pure weakness set in when the PMO dropped beneath the zero line, and it is currently in effect. Had we followed the signal, it would've saved quite a bit of downside.
The rest of the chart looks pretty terrible, as well with a negative RSI and Stochastics below 20. Additionally, relative strength is failing across the board.
We see a similar setup on GOOGL, but this time the signal is arriving NOW as the PMO dropped beneath the zero line. While this doesn't mean a precipitous decline is ahead, it does tell us to tighten up stops, at the very least.
There are signs that there might be further decline ahead for GOOGL. The RSI is negative, and Stochastics are below 20. Additionally, relative strength is failing across the board.
Conclusion: The PMO can be used to determine the strength or weakness in a particular move based on its location and direction around the zero line. Based on the PMO, both Apple and Google are displaying pure weakness.
If you like this style of analysis, we welcome you to come try DecisionPoint Diamonds reports, where I bring you 10 stock/ETF picks per week, with a discussion on the PMO and other factors like the ones listed above. Just use coupon code: DPTRIAL2 and you can try Diamonds out free for two weeks!
Learn more about DecisionPoint.com:
Watch the latest episode of the DecisionPointTrading Room on DP's YouTube channel here!

Try us out for two weeks with a trial subscription!
Use coupon code: DPTRIAL2 at checkout!
Technical Analysis is a windsock, not a crystal ball. --Carl Swenlin
(c) Copyright 2024 DecisionPoint.com
Disclaimer: This blog is for educational purposes only and should not be construed as financial advice. The ideas and strategies should never be used without first assessing your own personal and financial situation, or without consulting a financial professional. Any opinions expressed herein are solely those of the author, and do not in any way represent the views or opinions of any other person or entity.
DecisionPoint is not a registered investment advisor. Investment and trading decisions are solely your responsibility. DecisionPoint newsletters, blogs or website materials should NOT be interpreted as a recommendation or solicitation to buy or sell any security or to take any specific action.
Helpful DecisionPoint Links:
Price Momentum Oscillator (PMO)
Swenlin Trading Oscillators (STO-B and STO-V)


