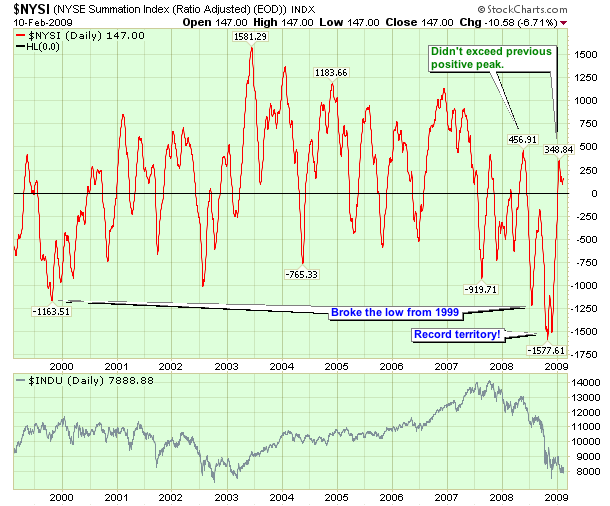
Click here for a live version of this chart.
The McClellan Summation Index is a great market indicator that recently set some all-time record lows back at the end of last year. Since then, it has bounced back into positive territory, but over the past couple of days a new decline has begun. While not unexpected, that is disappointing since "according to the McClellans, the beginning of a new bull market is signaled if the NYSE-based Summation index first moves below the -1200 level and then quickly rises above +2500."

About the author:
Chip Anderson is the founder and president of StockCharts.com.
He founded the company after working as a Windows developer and corporate consultant at Microsoft from 1987 to 1997.
Since 1999, Chip has guided the growth and development of StockCharts.com into a trusted financial enterprise and highly-valued resource in the industry.
In this blog, Chip shares his tips and tricks on how to maximize the tools and resources available at StockCharts.com, and provides updates about new features or additions to the site.
Learn More


