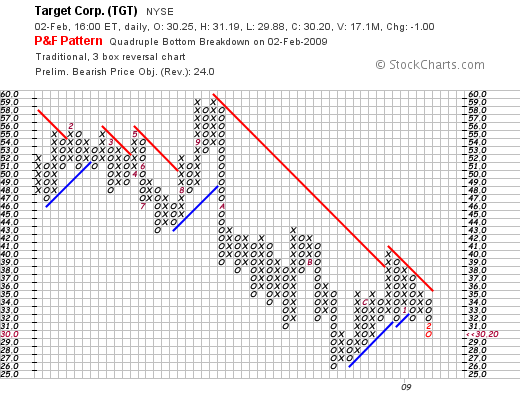
Target Corp's Point and Figure chart broke below the bottom of the Quadruple Bottom Pattern that it had put in over the past 5 weeks. See the 4 "O's" in the boxes at 32? Those "O's" formed the bottom of the pattern. Today's decline to 30.20 filled in the 31 and 30 boxes, signaling the breakdown.

About the author:
Chip Anderson is the founder and president of StockCharts.com.
He founded the company after working as a Windows developer and corporate consultant at Microsoft from 1987 to 1997.
Since 1999, Chip has guided the growth and development of StockCharts.com into a trusted financial enterprise and highly-valued resource in the industry.
In this blog, Chip shares his tips and tricks on how to maximize the tools and resources available at StockCharts.com, and provides updates about new features or additions to the site.
Learn More


