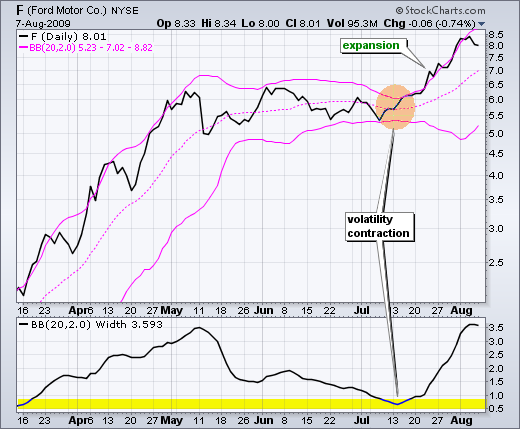
Volatility contractions often precede volatility expansions. This is the rational behind Bollinger Bands. After surging above 5.5, Ford (F) formed a long consolidation and Bollinger Bands contracted as the range narrowed. The subsequent move above resistance and the upper Bollinger Band triggered the volatility expansion (breakout). Note: This is an educational post featuring a technical analysis technique.

Click on this chart to see more details.
To find stocks with narrowing Bollinger Bands, use the Market Carpet tool and select Bollinger Band width.

About the author:
Arthur Hill, CMT, is the Chief Technical Strategist at TrendInvestorPro.com. Focusing predominantly on US equities and ETFs, his systematic approach of identifying trend, finding signals within the trend, and setting key price levels has made him an esteemed market technician. Arthur has written articles for numerous financial publications including Barrons and Stocks & Commodities Magazine. In addition to his Chartered Market Technician (CMT) designation, he holds an MBA from the Cass Business School at City University in London.
Learn More


