Don't Ignore This Chart! March 30, 2010 at 06:54 PM
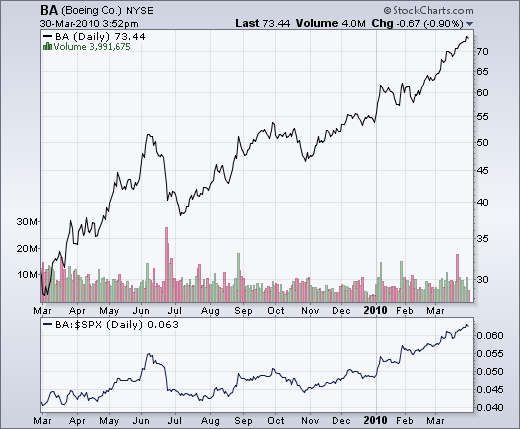
A look at the predefined scans page shows new 52-week highs outpacing new 52-week lows by a wide margin. In fact, new lows are quite minimal, which is hardly surprising considering the current rally is some 55 weeks old... Read More
Don't Ignore This Chart! March 29, 2010 at 08:55 PM
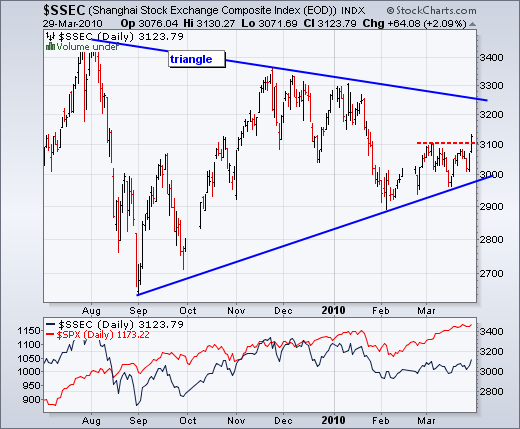
It's been a long time coming, but the Shanghai Composite ($SSEC) finally broke above 3100 resistance. The index has been lagging the S&P 500 the last six weeks as it traded flat. Today's break above 3100 takes the index to its highest level since January... Read More
Don't Ignore This Chart! March 26, 2010 at 10:35 AM
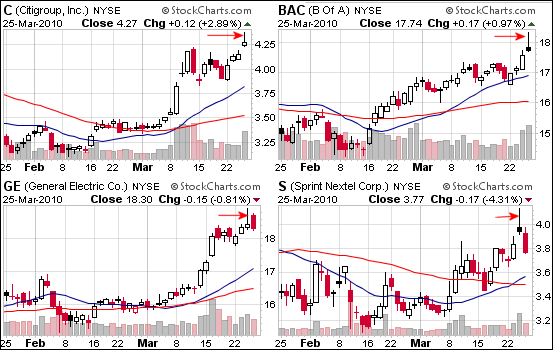
Shooting star candlesticks are popping up after a couple of volatile days. A CandleGlance view of Thursday's most active list shows shooting stars in the four most active stocks. GE and S formed shooting stars on Wednesday. C and BAC formed shooting stars on Thursday... Read More
Don't Ignore This Chart! March 24, 2010 at 09:14 PM
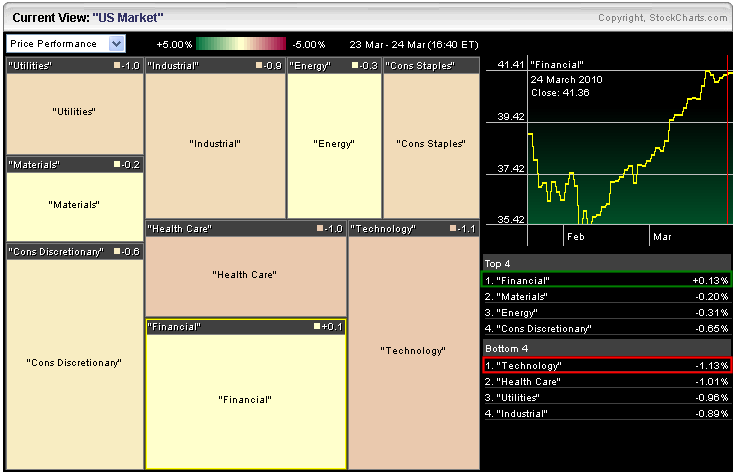
The Market Carpet shows the technology, healthcare and utilities sectors leading the market lower on Wednesday. The average decline for stocks in these sectors was 1.13%, 1.01% and .96%, respectively. Only financials were up with the average advance per stock running .13%... Read More
Don't Ignore This Chart! March 23, 2010 at 02:46 PM
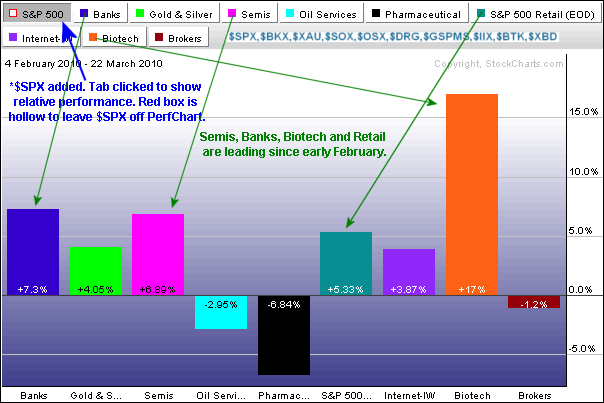
The John Murphy industry group PerfChart shows banks, biotechs, retail and semis leading the market higher since early February. Oil services and pharmaceuticals are lagging the S&P 500... Read More
Don't Ignore This Chart! March 22, 2010 at 09:48 PM
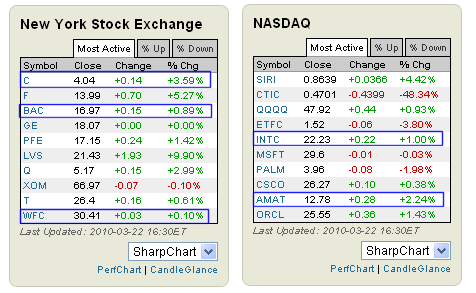
From the Free Charts page, the most active list for the NYSE shows strength in three banks (C, BAC, WFC). The most active Nasdaq list shows strength in two semis (INTC, AMAT). The CandleGlance link at the bottom of these tables shows all 10 with small candlestick charts... Read More
Don't Ignore This Chart! March 19, 2010 at 08:27 AM
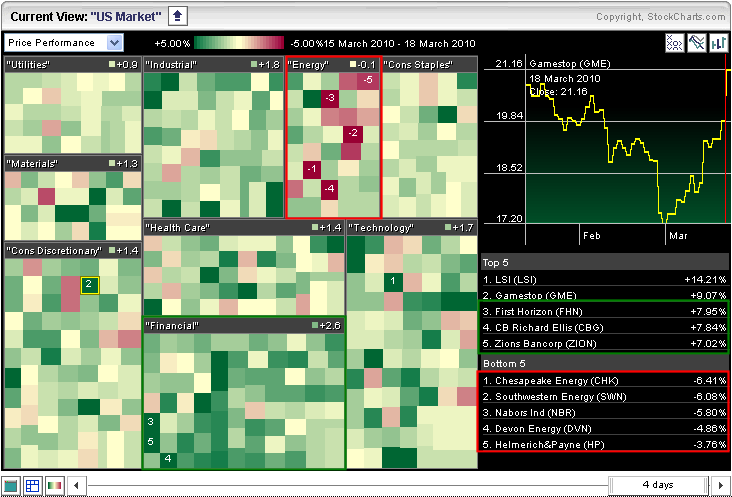
The Sector Market Carpet shows gains across eight of the nine sectors over the last four days. The energy sector is the only one not sporting a gain this week. Notice that the "bottom 5" performing stocks come from this sector as well... Read More
Don't Ignore This Chart! March 18, 2010 at 02:59 PM
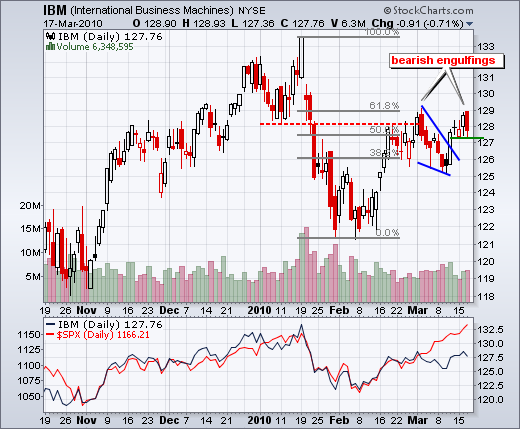
For the second time in three weeks, IBM made the bearish engulfing scan and confirmed resistance at 129. The stock first hit resistance here in early March. The bearish engulfing has yet to be confirmed as the stock stays range bound the last five days. Watch 127 down and 129 up... Read More
Don't Ignore This Chart! March 17, 2010 at 03:08 PM
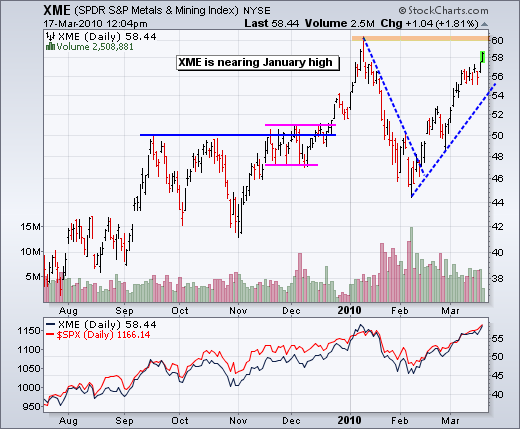
Materials and Energy related ETFs have been lagging the broader market because many remain below their January highs. That may be changing. The chart below shows the Metals & Mining SPDR (XME) surging towards its January high with a move over the last two days... Read More
Don't Ignore This Chart! March 16, 2010 at 08:30 AM
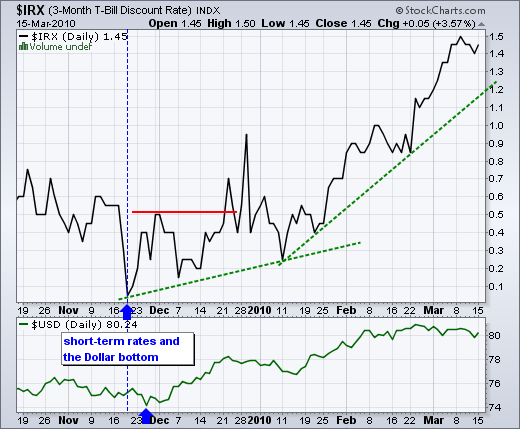
Even though the Fed is unlikely to raise rates today, the bond market is already doing some of the Fed's work. The 3-month T-Bill Rate ($IRX) bottomed at the end of November and surged over the last two months. Despite this big move, $IRX is still low by historical standards... Read More
Don't Ignore This Chart! March 15, 2010 at 03:54 PM
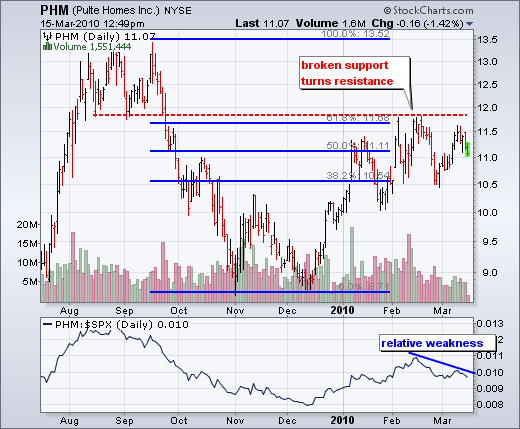
Pulte Homes (PHM) is hitting resistance from broken support and the 62% retracement around 11.8. The stock hit this resistance zone twice in February and formed a lower high in March. Also notice that PHM is underperforming the S&P 500 over the last few weeks... Read More
Don't Ignore This Chart! March 12, 2010 at 03:22 PM
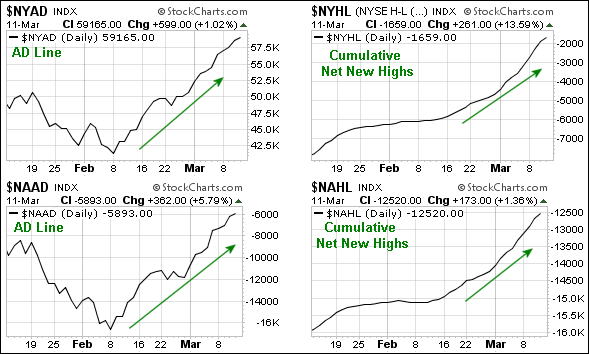
NYSE and Nasdaq breadth continues to expand and back up the current rally. From the breadth charts page at Stockcharts.com, we can see the NYSE AD Line ($NYAD) and Nasdaq AD Line ($NAAD) moving sharply higher the last five weeks... Read More
Don't Ignore This Chart! March 11, 2010 at 06:45 PM
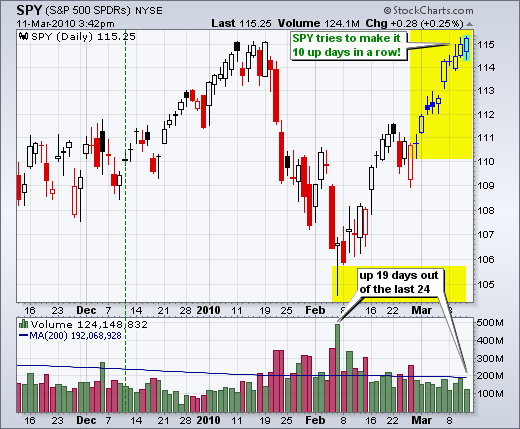
With a move into positive territory today, the S&P 500 ETF (SPY) is trying to make it 10 up days in a row. The ETF is also trying to make it 19 up days out of the last 24 days. Truly a remarkable run. Resistance from the January high is nigh... Read More
Don't Ignore This Chart! March 10, 2010 at 07:26 AM
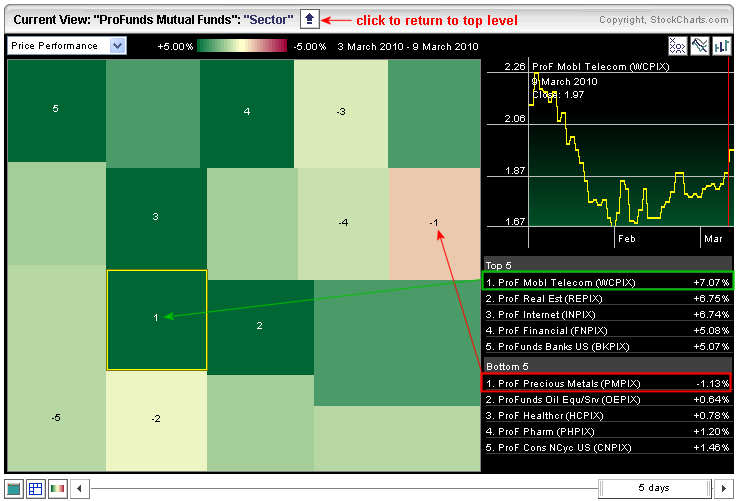
Even if you do not trade or invest with Profunds, the Profunds market carpet provides an excellent means to track sector/industry action. The Profunds Mutual Funds sector carpet shows 19 funds with the top/bottom five listed on the right... Read More
Don't Ignore This Chart! March 09, 2010 at 02:54 PM
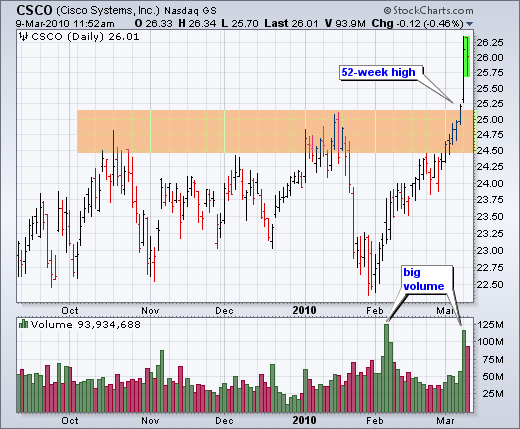
Cisco (CSCO) surged above resistance and recorded a new 52-week high ahead of Tuesday's big announcement. Notice how CSCO started its move with a volume surge in early February. While the new 52-week high is bullish, the stock is getting a bit frothy and the news is now out... Read More
Don't Ignore This Chart! March 08, 2010 at 02:00 PM
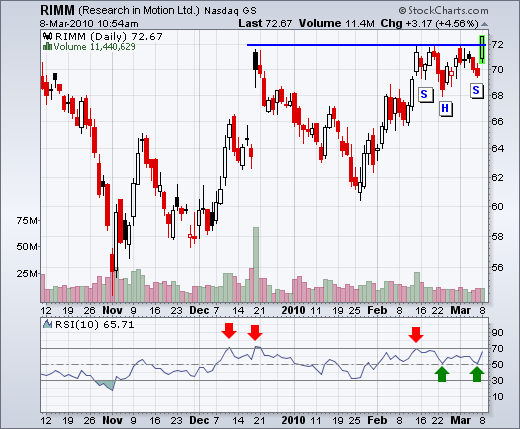
Research in Motion (RIMM) broke above resistance with a sharp advance in early trading on Monday. The chart shows resistance around 72 from the December-February highs... Read More
Don't Ignore This Chart! March 05, 2010 at 07:10 AM
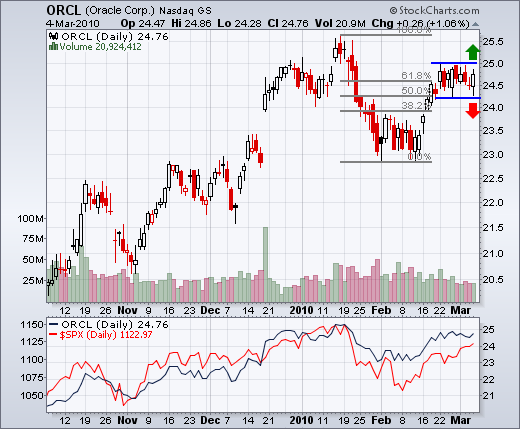
Oracle (ORCL) surged in mid February and then stalled over the last two weeks. The resolution of this consolidation will signal the next directional move. A break above resistance would be short-term bullish, while break below support would be bearish... Read More
Don't Ignore This Chart! March 04, 2010 at 01:53 PM
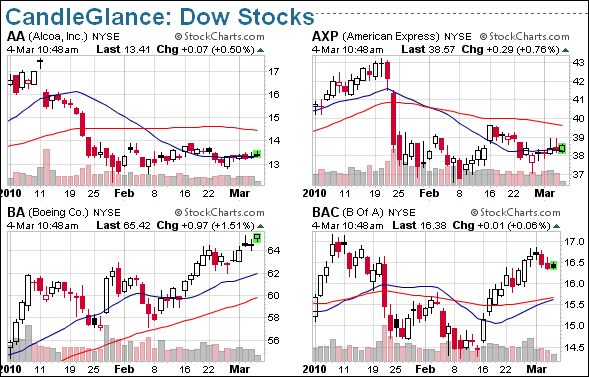
A look at the CandleGlance page for the Dow stocks shows Alcoa (AA) and American Express (AXP) lagging in February. The Dow and S&P 500 were up sharply in February, but these two stocks simply consolidated and shows relative weakness... Read More
Don't Ignore This Chart! March 02, 2010 at 01:08 PM
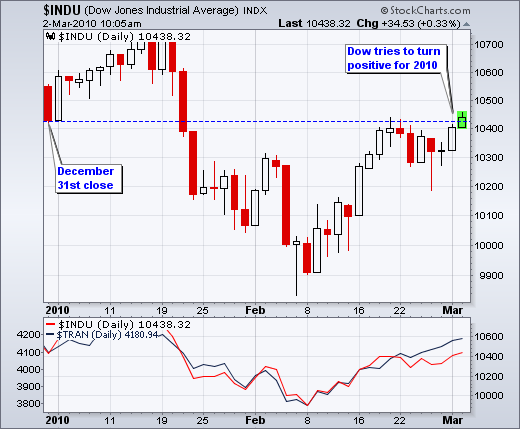
The Dow Industrials is attempting to turn positive for 2010. The senior Average closed at 10,428 on December 31st and flirted with the 10428 area 7-8 days ago. After falling back below 10300 last week, the Dow is making another go at positive ground... Read More
Don't Ignore This Chart! March 01, 2010 at 08:04 AM
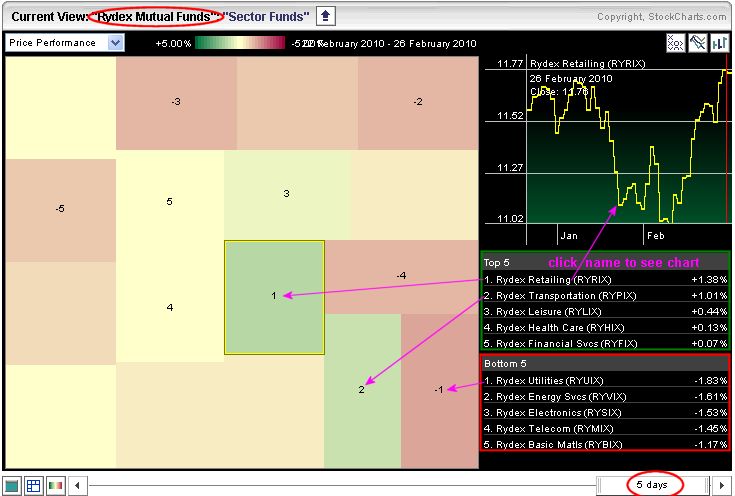
The Market Carpet for the Rydex Sector Funds shows the Rydex Retailing Fund (RYRIX) leading the way higher last week. Notice that the slider at the bottom is set at 5 days to show last week's results. The Rydex Transportation Fund (RYPIX) came in second with a 1.01% gain... Read More