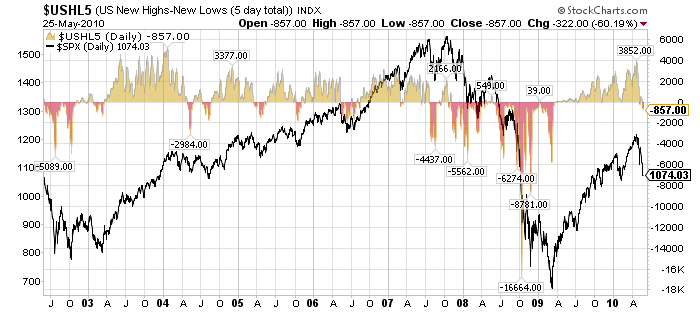
Here's a 8 year look at a new market indicator that we just added to the website - the "Weekly New High - New Low Index" popularized by Dr. Alexander Elder in his books.

Click here for a live version of this chart.
The index (in yellow and red) has the S&P 500 overlaid on top of it for context.
The index is computed by counting up all of the US stocks (on any of the three major exchanges) that are making new 52-week highs and subtracting all of the US stocks that are making new 52-week lows. That gets you the "Daily" version of this index ($USHL). To get the "Weekly" version, you add up the daily values for the past five days and plot that.
As you can see, this market indicator does a pretty good job on keeping you on the right side of the market. Dr. Elder follows it very closely - now you can too.


