Don't Ignore This Chart!

$VIX Spikes Up Above 35 - What Does That Mean For the Market?

Chip Anderson

Chip Anderson

President, StockCharts.com

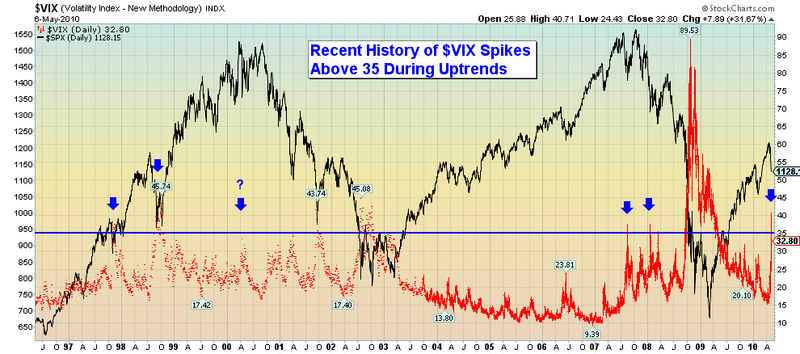
Today's wild day cause the Volatility Index ($VIX) to spike up above 35 for the first time during the current market uptrend.  The follow chart shows what the market has done in the past when that signal has occurred:

VIXAbove35
Click here for a live version of this chart.

In the late 90's the market ignored the signal and kept climbing until May of 2000 when $VIX gave the signal a third time (or came really close to giving it, we only have close data for $VIX at that time).

In 2007, the same signal occurred twice just before and after the market topped.

Today, the signal occurred again.  It will be very interesting to see how significant the signal is this time.

Chip Anderson
About the author: is the founder and president of StockCharts.com. He founded the company after working as a Windows developer and corporate consultant at Microsoft from 1987 to 1997. Since 1999, Chip has guided the growth and development of StockCharts.com into a trusted financial enterprise and highly-valued resource in the industry. In this blog, Chip shares his tips and tricks on how to maximize the tools and resources available at StockCharts.com, and provides updates about new features or additions to the site. Learn More