Don't Ignore This Chart! June 29, 2010 at 02:47 PM
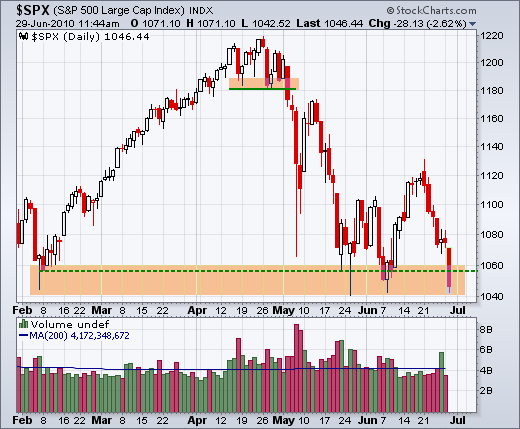
With a sharp decline early Tuesday, the S&P 500 is once again testing the May-June lows. In fact, this test also involves the February low. The 1040 level held in February, late May and early June... Read More
Don't Ignore This Chart! June 28, 2010 at 08:33 PM
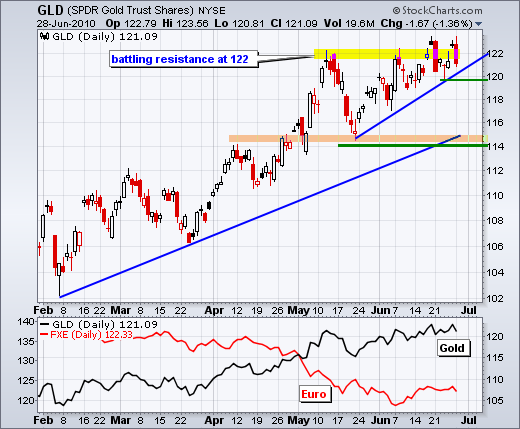
For the second time in two weeks, the Gold ETF (GLD) surged above resistance at 122 and then moved back below with a long red candlestick. The overall uptrend in GLD remains in place, but there is considerable resistance in this area. First support is set at last week's lows... Read More
Don't Ignore This Chart! June 25, 2010 at 08:27 AM
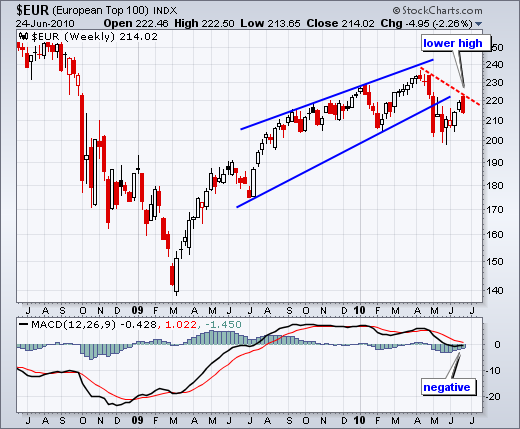
The Euro Top-100 Index ($EUR) is forming a potentially lower high with bearish momentum. After a bounce in June, the index reversed course this week with an outside reversal well below the April high... Read More
Don't Ignore This Chart! June 24, 2010 at 06:23 PM
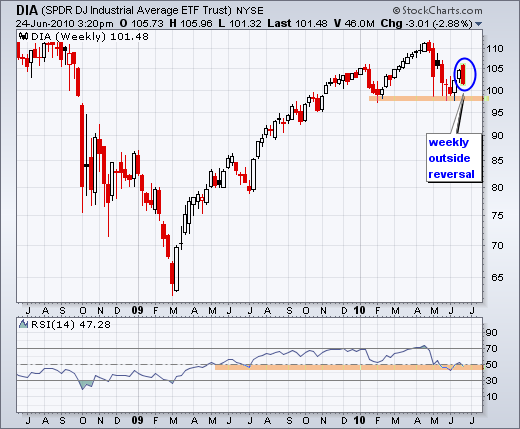
As of late Thursday afternoon, the Dow SPDR (DIA) was forming a weekly outside reversal. Notice how Monday's trading started above last week's close and is now below last week's open. This week's reversal has completely engulfed the prior white candlestick... Read More
Don't Ignore This Chart! June 23, 2010 at 09:06 AM
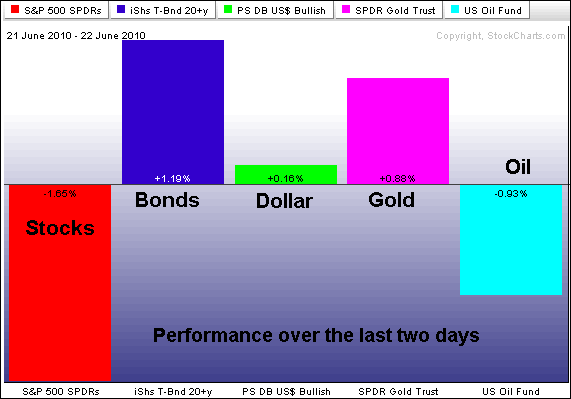
The PerfChart below shows the performance for five intermarket related ETFs over the last two days. Stocks and the oil are down as money moved out of risk ahead of Wednesday's FOMC policy statement... Read More
Don't Ignore This Chart! June 22, 2010 at 03:05 PM
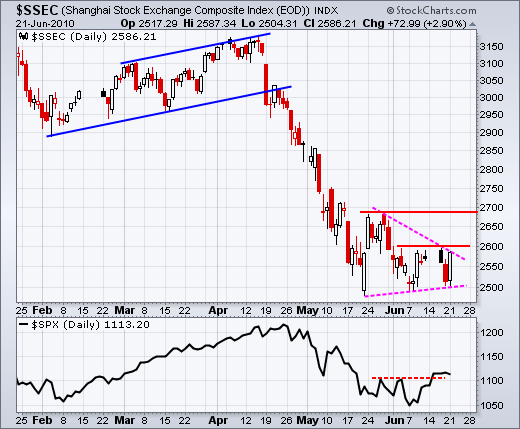
Despite a big bounce on Monday's currency news, the Shanghai Composite ($SSEC) remains within a trading range and continues to show relative weakness. After a sharp decline in April-May, the index formed a triangle consolidation around 2550... Read More
Don't Ignore This Chart! June 21, 2010 at 12:59 PM
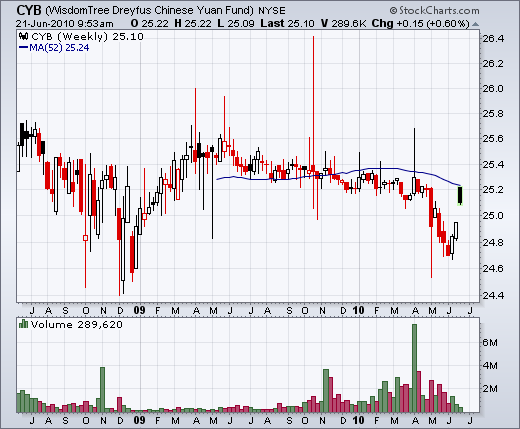
News that China adjusted its currency's peg to the Dollar sent the Chinese Yuan Fund (CYB) surging back above 25. While the three week move may seem impressive, the ETF is really just making it back to its 52-week average. In fact, the ETF spent most of 2009 trading between 25... Read More
Don't Ignore This Chart! June 18, 2010 at 08:33 AM
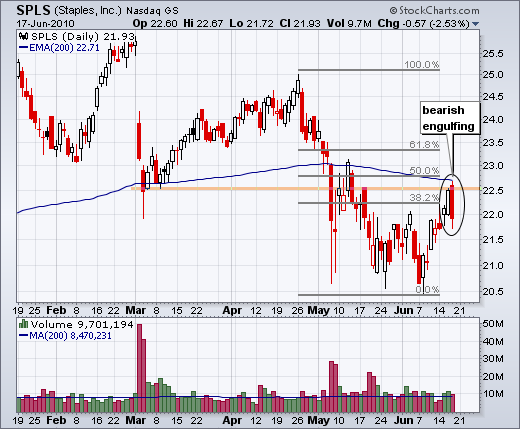
Staples surged with the rest of the market over the prior seven days, but hit resistance from broken support with a bearish engulfing candlestick on Thursday. Also notice that the falling 200-day EMA and the 50% retracement mark... Read More
Don't Ignore This Chart! June 17, 2010 at 08:03 PM
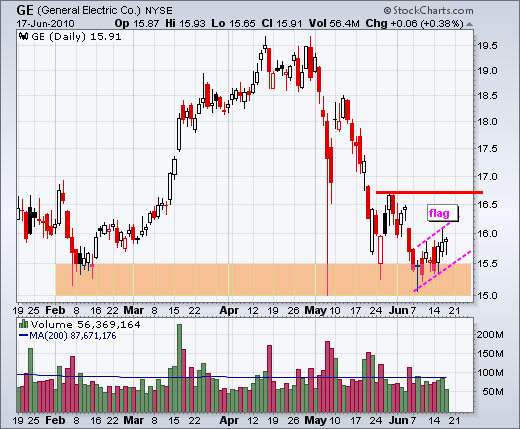
GE is trying to bounce off its February low, but the bounce look feeble so far and the stock shows relative weakness. The stock shows relative weakness because the S&P 500 broke above resistance and GE remains below corresponding resistance. The support zone around 15-15... Read More
Don't Ignore This Chart! June 16, 2010 at 06:34 PM
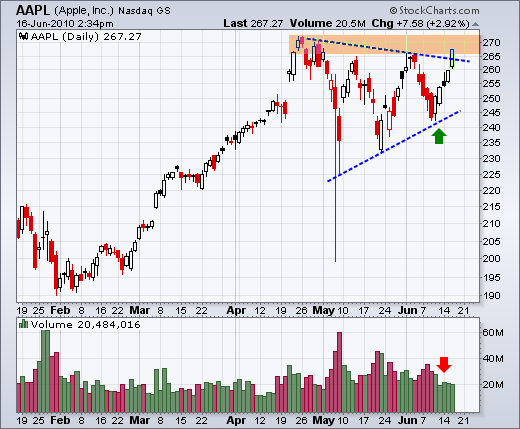
Apple (AAPL) remains one of the strongest stocks as it surges to resistance from the April-June highs. The stock formed a triangle over the last 2-3 months and broke the upper trendline today. Volume was light though. QQQQ traders should note that Apple accounts for 18... Read More
Don't Ignore This Chart! June 15, 2010 at 02:49 PM
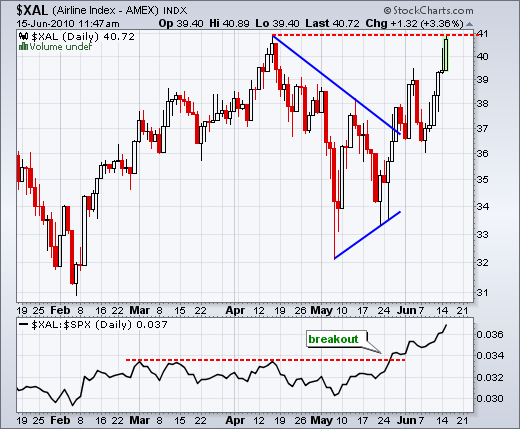
Airlines continue to show relative strength and upside leadership. First, the Airline Index ($XAL) is challenging its April high with a big move on Tuesday. A break would forge a new 52-week high. Second, the price relative broke out in late May and recorded a new high this week... Read More
Don't Ignore This Chart! June 14, 2010 at 10:28 AM
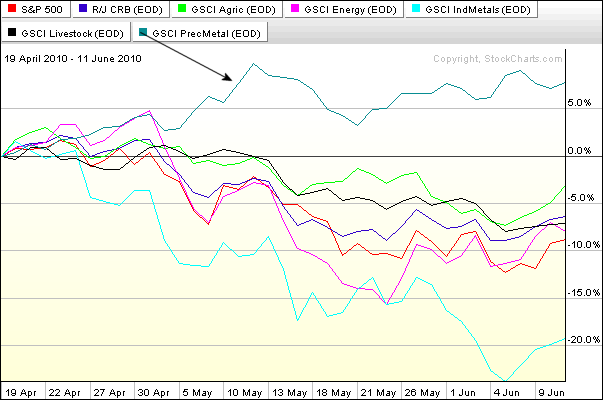
With the exception of precious metals, commodity indices have gone the way of the stock market over the last eight weeks. The PerfChart below shows the S&P 500 six commodity related indices. Only the GSCI Precious Metals Index ($GPX) shows a gain since mid April... Read More
Don't Ignore This Chart! June 11, 2010 at 06:45 AM
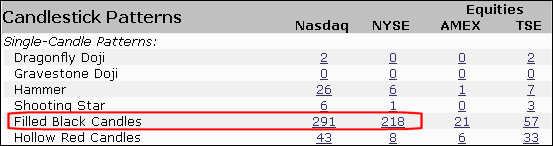
Looking through the pre-defined scans page, it was surprising to see a high number of filled black candlesticks on Thursday. These candlesticks form when the close is below the open and the close is above the prior close... Read More
Don't Ignore This Chart! June 10, 2010 at 07:10 AM
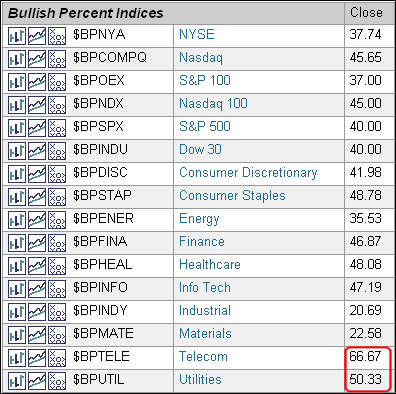
Stockcharts.com tracks the Bullish Percent Indices (BPI) for six major indices and 10 sectors. The BPIs for the major indices are below 50% and eight of the ten sectors have BPIs below 50%. Only telecom and utilities have BPIs above 50%... Read More
Don't Ignore This Chart! June 09, 2010 at 06:55 PM
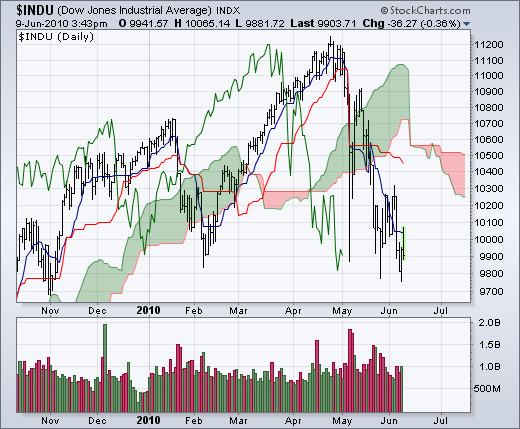
Ichimoku Clouds, a form of Japanese technical analysis, show a trend reversal in the Dow Industrials. The senior average broke below the cloud formation and the "Standard Line" moved below the cloud formation... Read More
Don't Ignore This Chart! June 08, 2010 at 09:12 AM
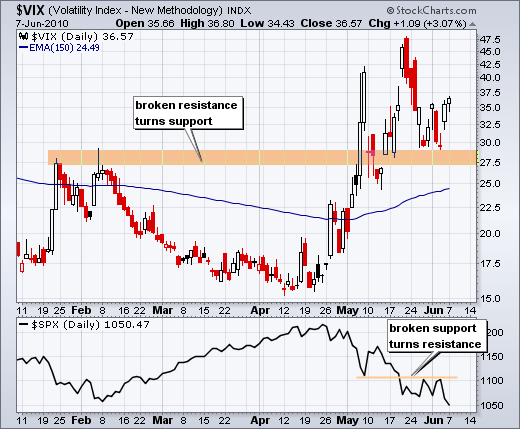
The S&P 500 Volatility Index ($VIX) surged in May and broke above its January-February high. After a pullback, the index found support near broken resistance and bounced the last few days. Also notice that the S&P 500 hit resistance near broken support... Read More
Don't Ignore This Chart! June 07, 2010 at 08:41 AM
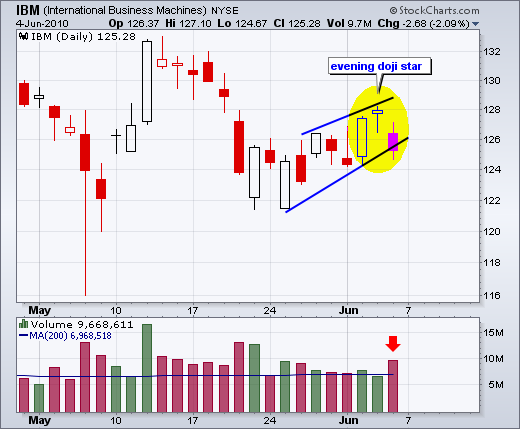
With a short-term reversal in stocks over the last three days, the evening star scan was about as full as it's been in a long time. IBM formed an evening star with a long white candlestick on Wednesday, a gap-stall on Thursday and a gap-decline on Friday... Read More
Don't Ignore This Chart! June 04, 2010 at 08:38 AM
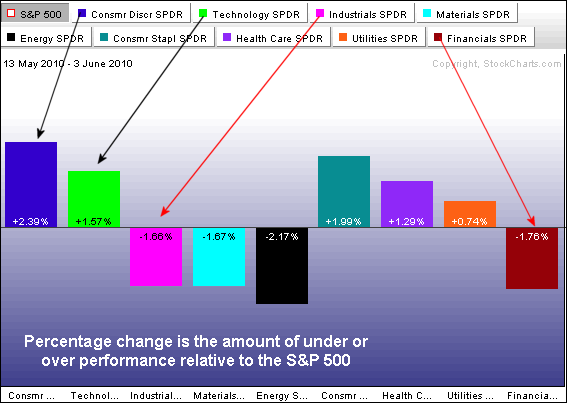
The sector perfchart provides an easy means to identify the leaders and laggards. Even though all sectors are down over the last three weeks (since May 13), some are down more than the S&P 500 (laggards) and some are down less (leaders)... Read More
Don't Ignore This Chart! June 03, 2010 at 02:00 PM
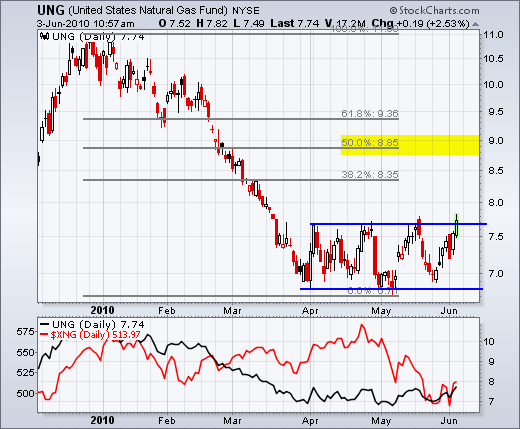
The US Natural Gas Fund (UNG) is perking up with a little break above the April-May highs today. However, like the commodity itself, UNG remains in a long-term downtrend... Read More
Don't Ignore This Chart! June 02, 2010 at 08:13 PM
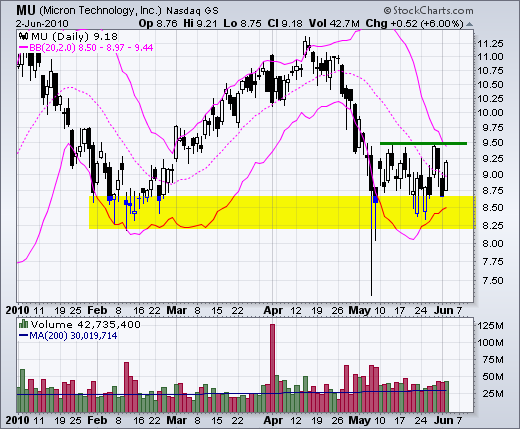
Micron Technology (MU) is testing support with a consolidation over the last four weeks. Support in the 8.25-8.5 area stems from the February lows. The stock has been trading between 8.25 and 9.5 since May 10th. Also notice that the Bollinger Bands are narrowing... Read More
Don't Ignore This Chart! June 01, 2010 at 06:04 PM
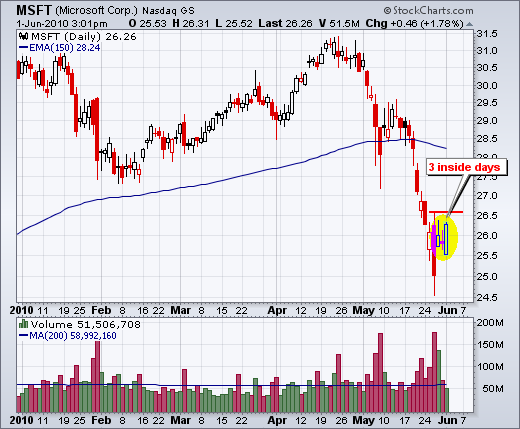
After becoming oversold and plunging on high volume last week, Microsoft is starting to firm with three inside days. Notice the long red candlestick on high volume four days ago... Read More