Don't Ignore This Chart! September 30, 2010 at 12:30 AM
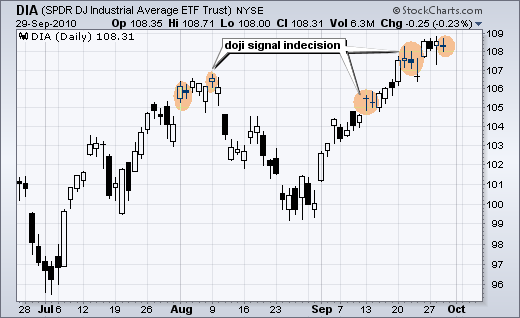
The Dow Industrials SPDR(DIA) signaled indecision on Wednesday with a small doji. Wednesday marks the fourth straight close in the 108-109 area. Doji can sometimes foreshadow a reversal, such as in early August... Read More
Don't Ignore This Chart! September 28, 2010 at 08:30 PM
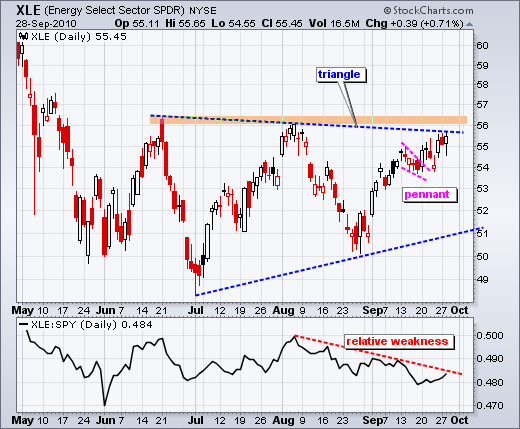
The Finance SPDR (XLF) and the Energy SPDR (XLE) are the only two sectors that have yet to break their summer highs. XLE is close as it works its way higher after a pennant breakout seven days ago... Read More
Don't Ignore This Chart! September 27, 2010 at 02:21 PM
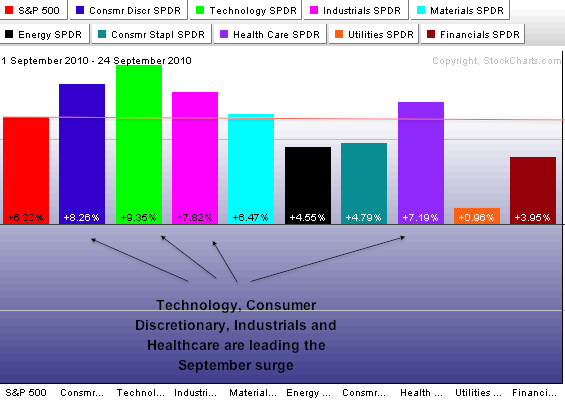
The S&P Sector PerfChart shows the percentage change for the nine sectors and the S&P 500. Those up more than the S&P 500 are leading. Those up less are lagging. In a surprising twist, both the technology and healthcare sectors are leading the S&P 500 higher... Read More
Don't Ignore This Chart! September 24, 2010 at 04:20 PM
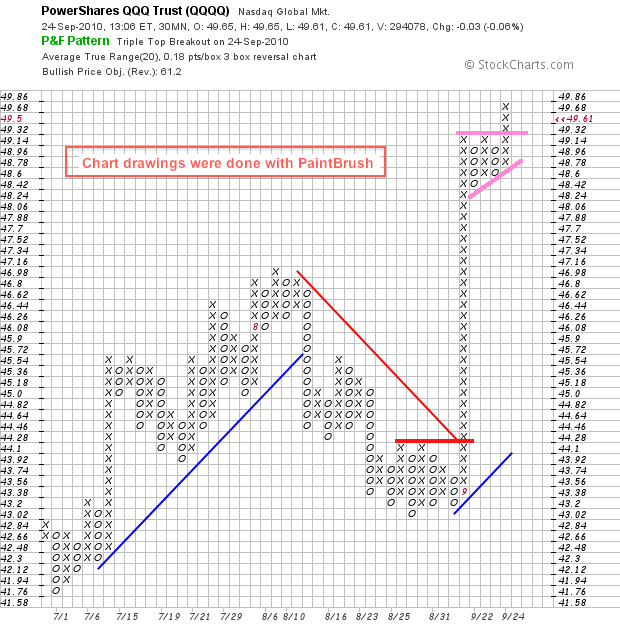
After consolidating for a few days, the Nasdaq 100 ETF (QQQQ) broke resistance with a surge on Friday. In fact, the 30-minute PnF chart shows an ascending triangle taking shape this week. These are bullish continuation patterns... Read More
Don't Ignore This Chart! September 23, 2010 at 08:27 PM
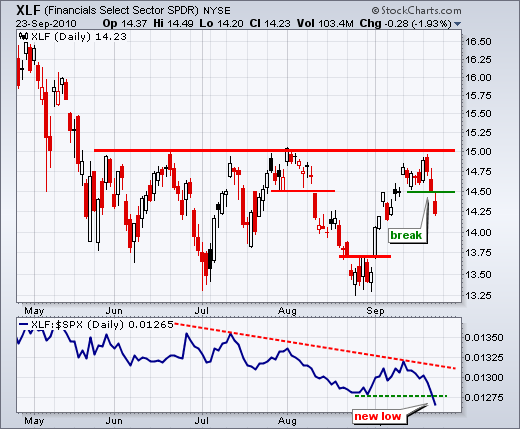
With a sharp decline the last three days, the Finance SPDR (XLF) failed at resistance for the fifth time since late May. In addition, the chart below shows the ETF breaking short-term support with a gap down... Read More
Don't Ignore This Chart! September 22, 2010 at 08:29 PM
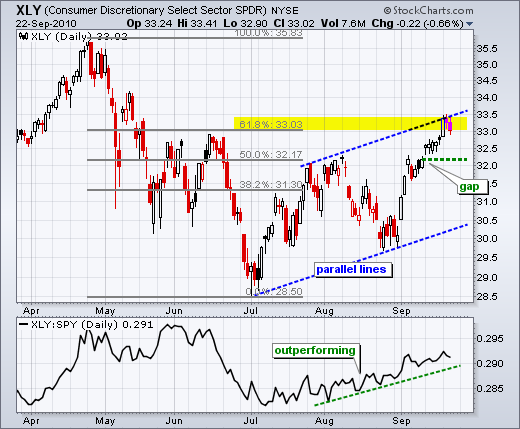
The Consumer Discretionary SPDR (XLY) is one of the leaders in September, but the ETF is now stalling near the upper trendline of a rising price channel. The lower trendline was drawn first and the upper trendline is parallel from the late July high... Read More
Don't Ignore This Chart! September 21, 2010 at 09:23 PM
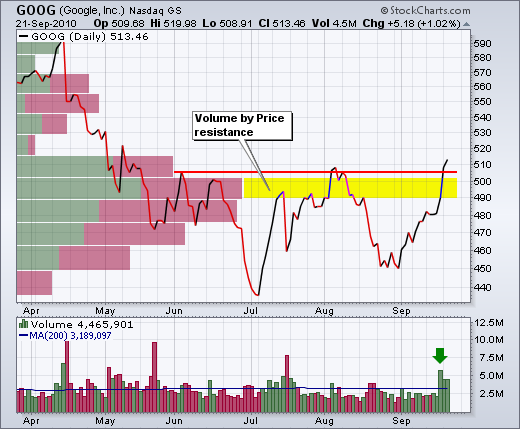
With a high volume surge the last three days, Google (GOOG) broke above Volume by Price resistance around 500. The stock also broke above its summer highs and has shown relative strength in September... Read More
Don't Ignore This Chart! September 21, 2010 at 01:12 PM
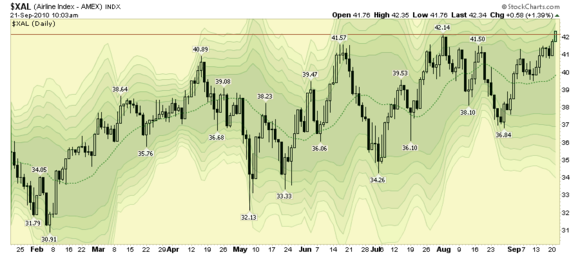
via stockcharts.com Airline stocks have been in the new recently and here's why. They are very close to punching through the recent resistance zone around 42... Read More
Don't Ignore This Chart! September 20, 2010 at 05:08 PM
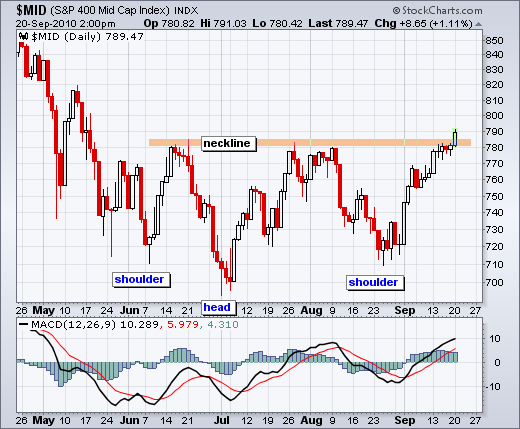
In addition to the S&P 500 ($SPX), the S&P MidCap 400 ($MID) formed an inverse head-and-shoulders pattern over the last four months and broke neckline resistance with a surge on Monday. MACD also remains in bull mode as it remains in positive territory and above its signal line... Read More
Don't Ignore This Chart! September 17, 2010 at 08:42 AM
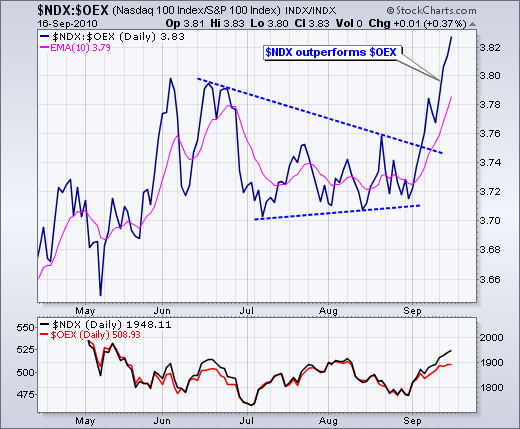
The Nasdaq 100 ($NDX) represents large-cap tech stocks and the S&P 100 ($OEX) represents large-cap everything. We can compare these two with the price relative or $NDX:$OEX ratio. With this ratio plot breaking to new highs, it is clear that $NDX is leaving $OEX in the dust... Read More
Don't Ignore This Chart! September 15, 2010 at 07:32 PM
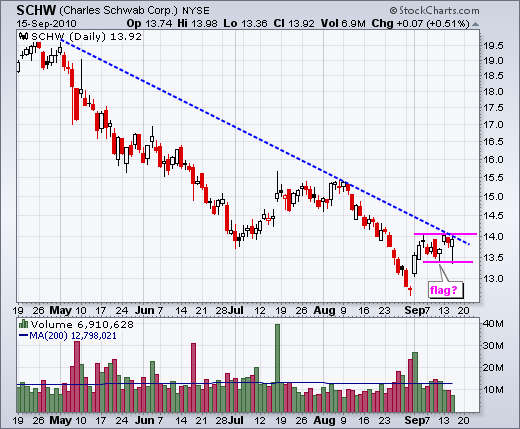
After a high volume surge at the start of September, Charles Schwab (SCHW) moved into a trading range the last two weeks. The pattern this month looks like a flat flag with resistance at the May trendline. A move above 14... Read More
Don't Ignore This Chart! September 14, 2010 at 08:53 AM
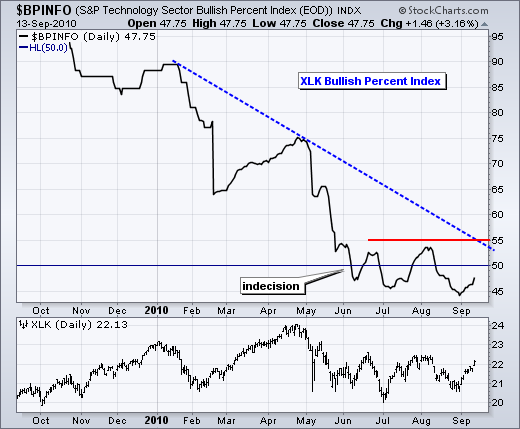
Since moving below 50% in June, the Info Tech Bullish% ($BPTECH) has been oscillating above/below the 50% line the last three months. This reflects indecision and a tug-of-war between bulls and bears. The overall trend is down for BPI, which gives the current edge to the bears... Read More
Don't Ignore This Chart! September 13, 2010 at 08:02 PM
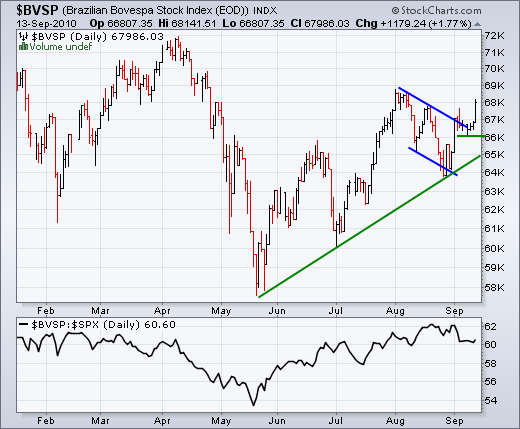
The Brazilian Bovespa Index ($BVSP) is one of the best performing markets since late May. After surging in July, the index formed a large falling flag in August and broke above flag resistance the last few days... Read More
Don't Ignore This Chart! September 10, 2010 at 09:20 AM
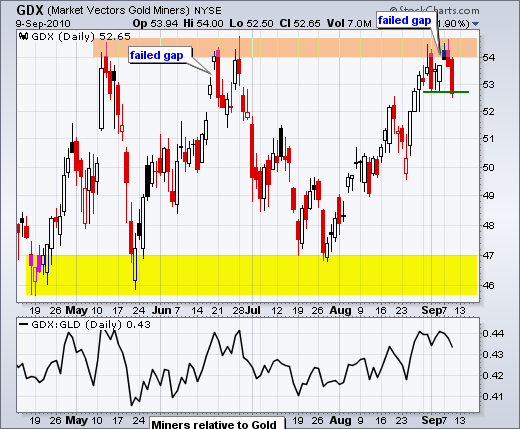
The Gold Miners ETF (GDX) surged to resistance at the end of August and then formed a big bearish engulfing the first trading day of September. After stalling on Thursday-Friday last week, the stock gapped up on Tuesday and then came down hard Wednesday-Thursday this week... Read More
Don't Ignore This Chart! September 09, 2010 at 05:43 PM
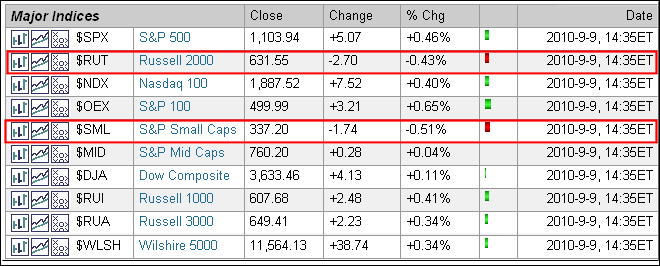
Even though the market as a whole was up on Thursday afternoon, a quick look at the intraday market summary reveals some relative weakness in small-caps. Of the 10 major indices shown, the Russell 2000 ($RUT) and the S&P 600 SmallCap Index ($SML) are the only two losers... Read More
Don't Ignore This Chart! September 08, 2010 at 12:25 PM
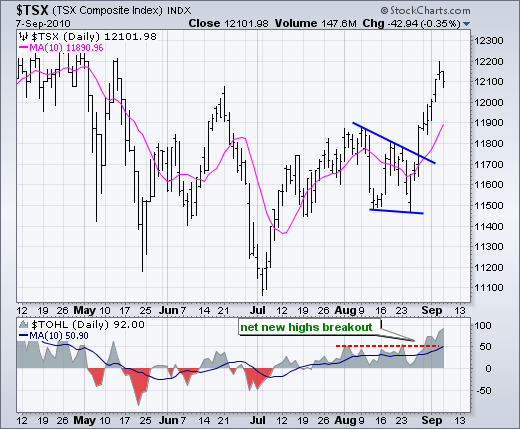
With a big move in the TSX Composite ($TSX) over the last two weeks, Net New Highs surged to their highest level since April. Notice that Net New Highs turned positive in early July, strengthened in August and then broke above +50 in late August... Read More
Don't Ignore This Chart! September 03, 2010 at 07:30 AM
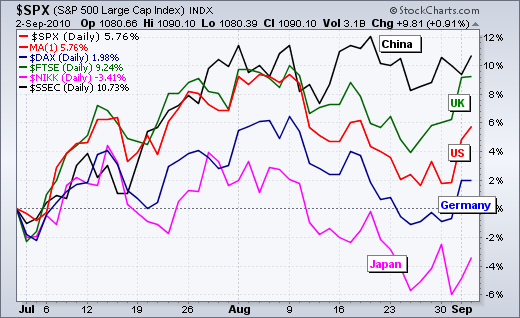
It has been quite a roller coaster the last two months. The S&P 500 (red) surged in July, fell sharply in August and surged over the last few days. While the S&P 500 went on its roller coaster ride, the Shanghai Composite (black) surged in July and consolidated in August... Read More
Don't Ignore This Chart! September 01, 2010 at 08:04 PM
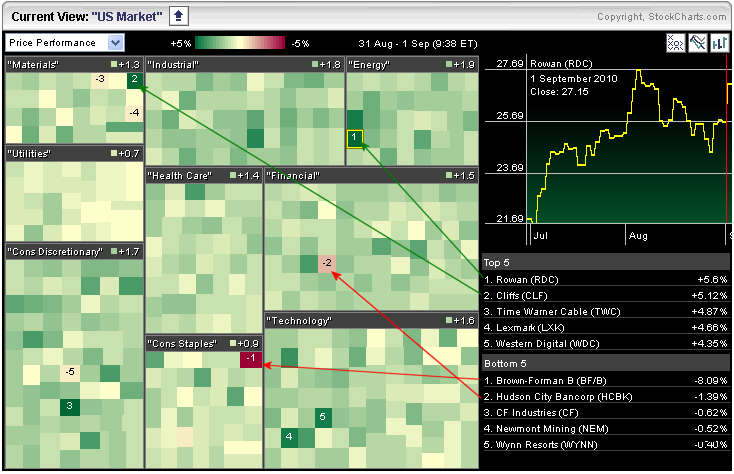
The S&P Sector Market Carpet shows a sea of green on Monday. All sectors were up sharply with consumer discretionary (+1.7) and technology (+1.6) showing the biggest average gains... Read More