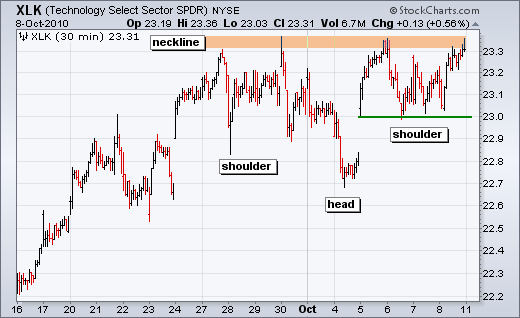
The Technology ETF (XLK) has been consolidating the last two weeks with a small inverse head-and-shoulders pattern. This pattern is best viewed using intraday charts. Neckline resistance resides around 23.3-23.5 and the ETF is testing this area for the fourth time since 27-Oct. A breakout would signal a continuation higher. The right shoulder lows mark support at 23.

Click this image for a live chart

About the author:
Arthur Hill, CMT, is the Chief Technical Strategist at TrendInvestorPro.com. Focusing predominantly on US equities and ETFs, his systematic approach of identifying trend, finding signals within the trend, and setting key price levels has made him an esteemed market technician. Arthur has written articles for numerous financial publications including Barrons and Stocks & Commodities Magazine. In addition to his Chartered Market Technician (CMT) designation, he holds an MBA from the Cass Business School at City University in London.
Learn More


