Don't Ignore This Chart! December 31, 2010 at 12:18 PM
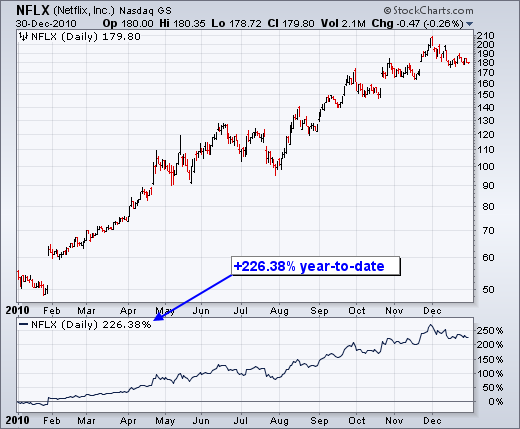
Hot off the press from our scan engine, 51 of the 500 stocks in the S&P 500 are up over 50% over the last 250 trading days, which is around one year. That's just over 10%, which makes for a pretty amazing year. 3 stocks are up more than 100% for the year... Read More
Don't Ignore This Chart! December 29, 2010 at 06:01 PM
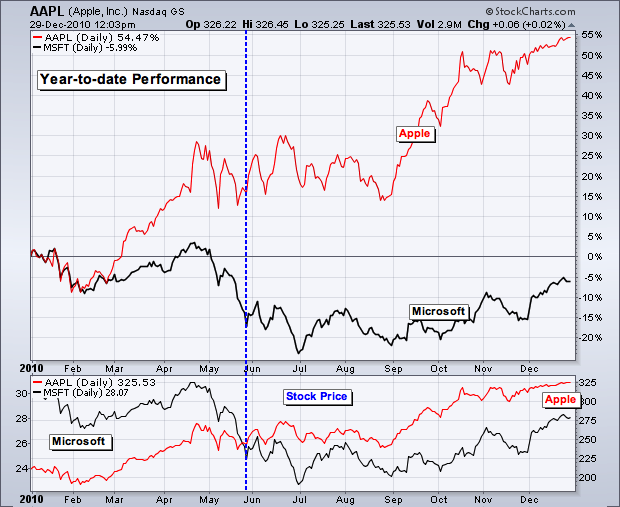
Here are the top 10 technical charting developments that happened during 2010 as selected by our crack staff of technical analysts. See if you agree... 10. Apple surpassed Microsoft in market capitalization on May 26th and gained over 50% on the year... Read More
Don't Ignore This Chart! December 28, 2010 at 02:42 PM
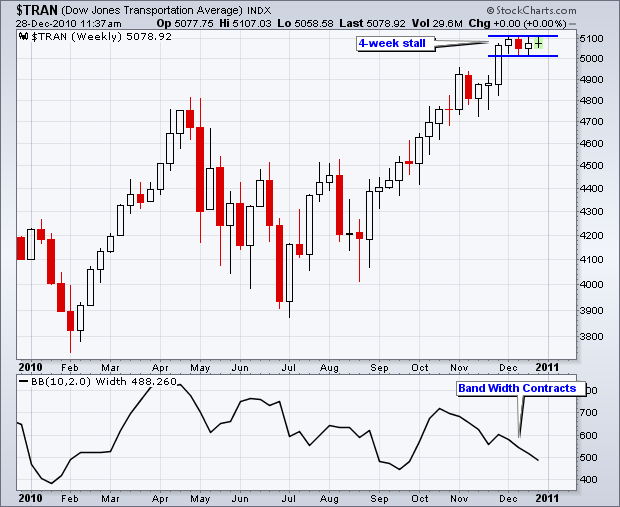
The Dow Transports have been flat for four weeks as the Average forms small weekly candlesticks in the 5000-5100 area. A visual assessment indicates that these are the smallest candlesticks of the year. Bollinger Band Width (10,2) contracts as the Average stalls... Read More
Don't Ignore This Chart! December 27, 2010 at 04:08 PM
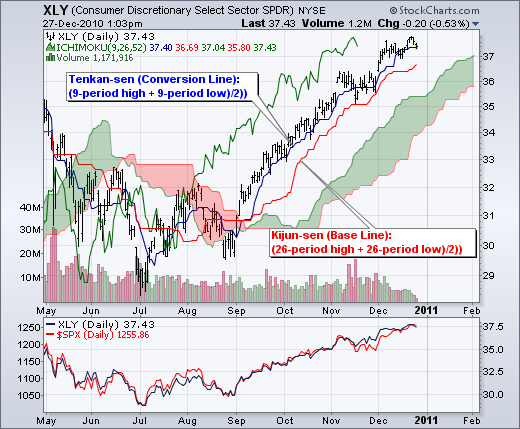
The Consumer Discretionary SPDR (XLY) remains in bull mode as the Conversion Line (blue) holds above the Base Line (red). The Kijun-sen (Base Line) equals: (26-period high + 26-period low)/2)). The Tenkan-sen (Conversion Line) equals: (9-period high + 9-period low)/2))... Read More
Don't Ignore This Chart! December 23, 2010 at 02:00 PM
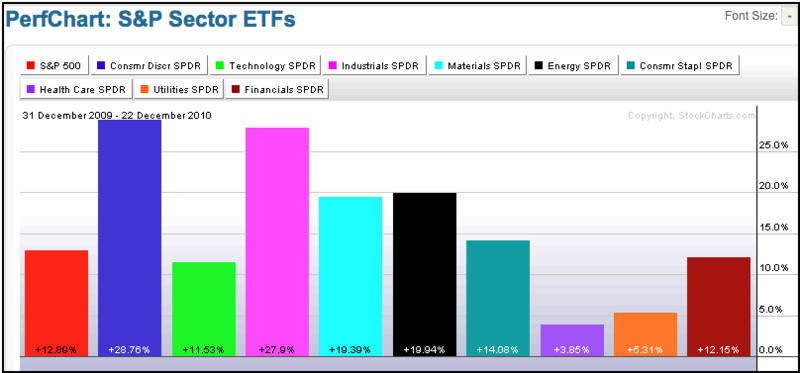
The S&P Sector PerfChart shows the consumer discretionary and industrials sectors leading the way in 2010. All sectors are up for the year, but these two are clearly the big leaders. Energy and materials came in a distance third and fourth, respectively... Read More
Don't Ignore This Chart! December 22, 2010 at 02:23 PM
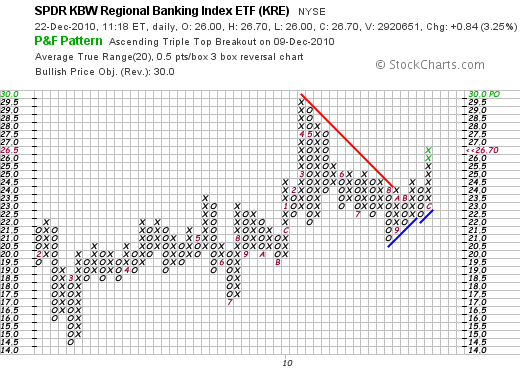
Point & Figure charts provide clear support and resistance levels. The P&F chart below shows the Regional Bank SPDR (KRE) breaking above resistance that extends back to June (red 6 on the chart). The 2010 high around 30 marks the next target for this breakout... Read More
Don't Ignore This Chart! December 21, 2010 at 05:51 PM
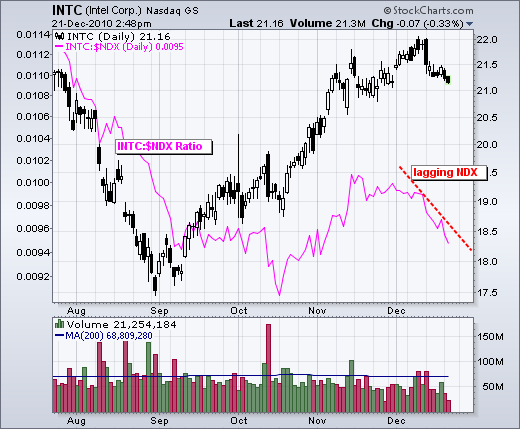
Stocks remained strong overall in December, but Intel (INTC) has been a noticeable laggard. The pink line shows the INTC:$NDX ratio. This relative strength comparative rises when Intel outperforms the Nasdaq 100 ($NDX) and falls when Intel underperforms... Read More
Don't Ignore This Chart! December 20, 2010 at 02:25 PM
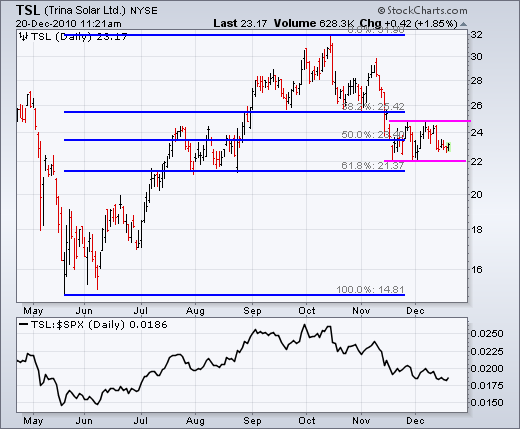
After declining from mid October to mid-November, TSL firmed near the 62% retracement mark over the last few weeks. The stock also has support here from the August consolidation. A break from the December range will trigger the next signal... Read More
Don't Ignore This Chart! December 17, 2010 at 03:31 PM
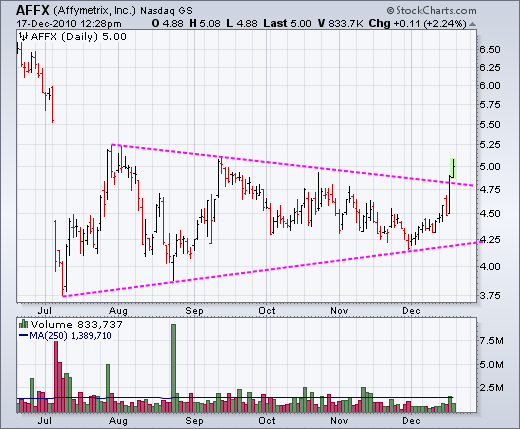
After a big gap down in July, Affymetrix began the long process of digesting this big loss. A long triangle consolidation formed over the last five months. December has been good to the stock with a steady advance and breakout over the last two days... Read More
Don't Ignore This Chart! December 16, 2010 at 03:24 PM
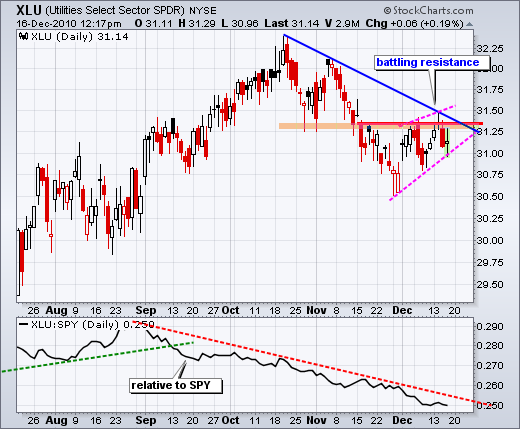
The Utilities SPDR (XLU) is underperforming the broader market as it battles resistance from broken support. Also notice that a rising wedge formed the last few weeks... Read More
Don't Ignore This Chart! December 15, 2010 at 11:36 AM
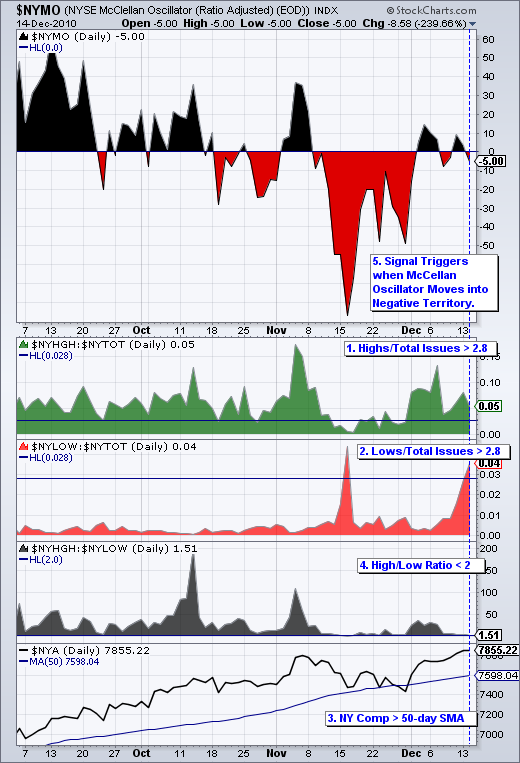
With a surge in NYSE new 52-week lows this week, the Hindenburg Omen has triggered once again. The last such signal was in mid August. There is some debate on the exact criteria and thresholds. The chart below details the criteria set forth from James Miekka... Read More
Don't Ignore This Chart! December 14, 2010 at 02:20 PM
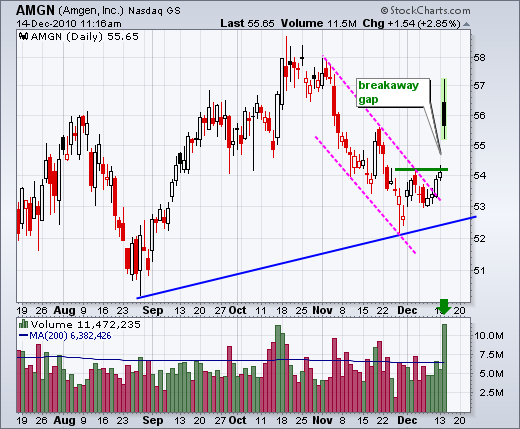
Amgen is off to the races today with a gap and breakout on big volume. This gap comes after the November decline and looks like a breakaway gap. High volume validates this move and the gap/breakout is bullish as long as it holds... Read More
Don't Ignore This Chart! December 13, 2010 at 05:30 PM
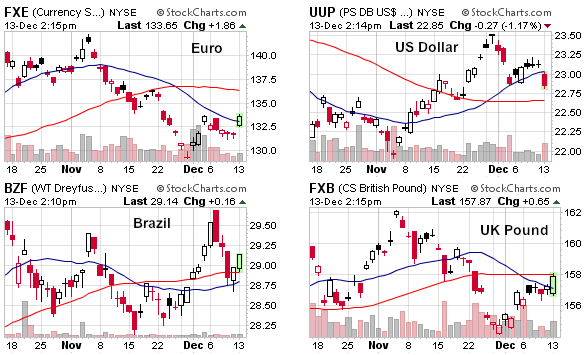
The Dollar is getting hammered on Monday with most other currencies moving higher. CandleGlance charts provide an easy way to reveal the leaders. The image below shows four or the 10 Candleglance currency charts. The Euro Currency Trust (FXE) is the clear leader with a 1... Read More
Don't Ignore This Chart! December 10, 2010 at 02:32 PM
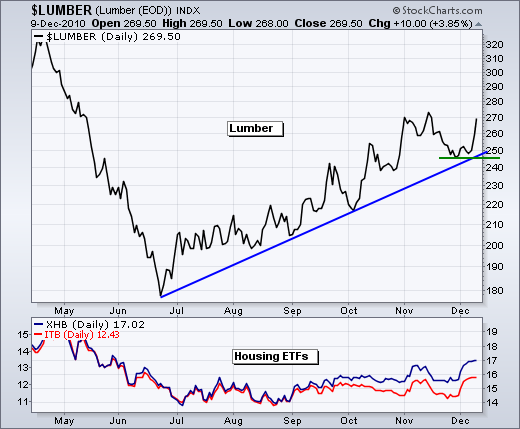
The Homebuilders SPDR and the Home Construction iShares (ITB) both surged this week and we are also seeing strength in Lumber ($LUMBER). On one hand, this increases building costs. On the other hand, it shows an increase in demand and this could mean more construction... Read More
Don't Ignore This Chart! December 09, 2010 at 02:19 PM
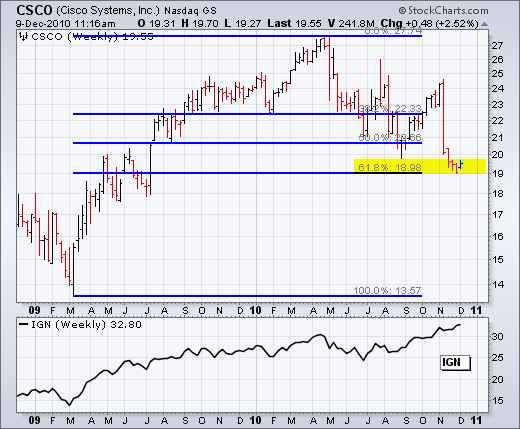
While the Networking iShares (IGN) trades near a 52-week high, Cisco (CSCO) flounders near a 52-week low. Who would have thunk it? Cisco is one of the top ten components in this ETF... Read More
Don't Ignore This Chart! December 08, 2010 at 01:55 PM
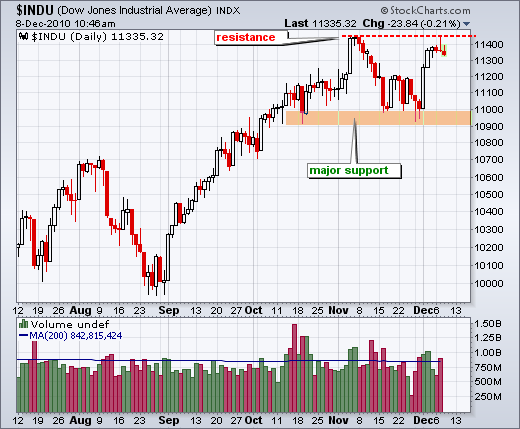
The Dow Industrials remains in an uptrend overall, but the senior Average is hitting some resistance from the November highs just above 11400. It is possible that a trading range takes shape after the sharp advance from 10000 to 11400... Read More
Don't Ignore This Chart! December 07, 2010 at 02:10 PM
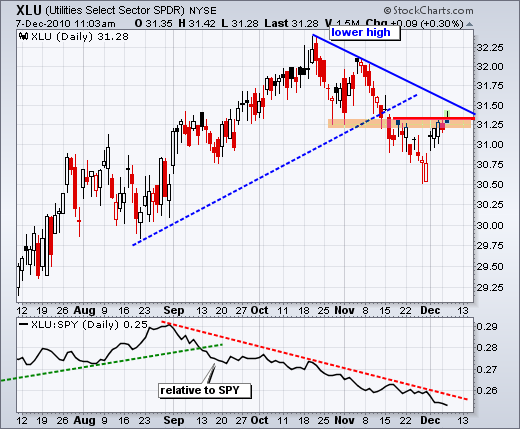
Despite a bounce the last five days, the Utilities SPDR (XLU) remains an underperformer since September. Notice how the price relative peaked and moved lower the last 3 months. On the price chart, the ETF is running into resistance from broken support around 31.30... Read More
Don't Ignore This Chart! December 06, 2010 at 09:07 PM
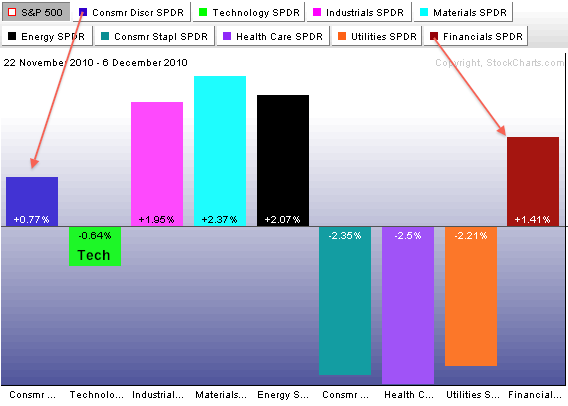
Except for technology, the offensive sectors are leading the market over the last two weeks. Relative to the S&P 500, consumer discretionary, industrials and finance are all positive on this relative strength PerfChart... Read More
Don't Ignore This Chart! December 03, 2010 at 04:40 PM
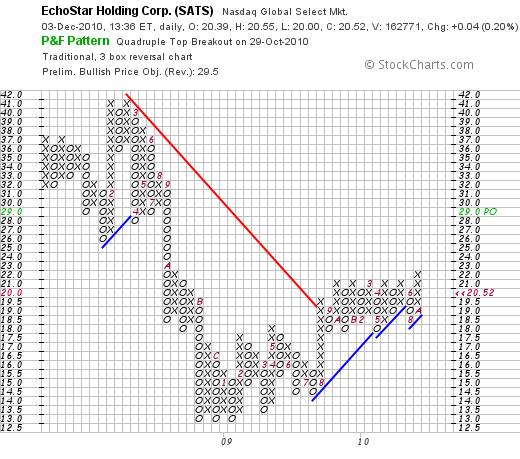
The Nasdaq Point & Figure Triple Top Breakout scan featured over 200 stocks on Friday morning. The chart below shows Echostar (SATS) breaking resistance marked by five columns of X's, which previous reversed at 22. This breakout is P&F bullish with a price objective (PO) of 29... Read More
Don't Ignore This Chart! December 02, 2010 at 06:33 PM
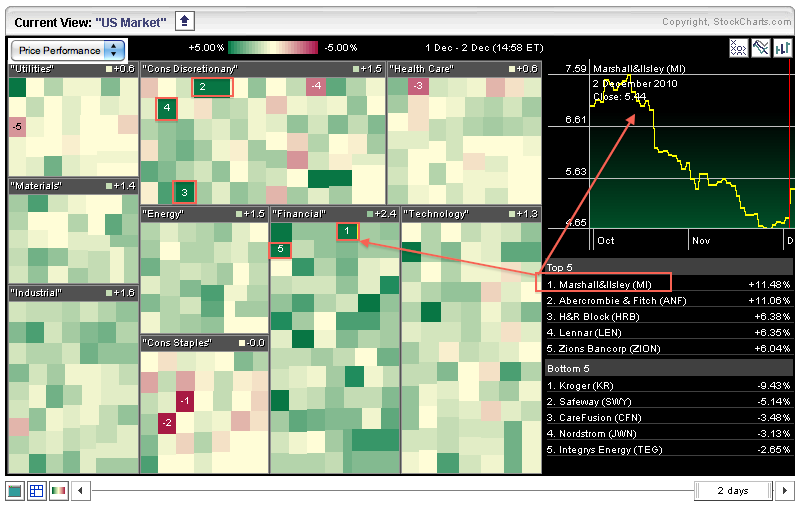
The finance sector sprang to life on Thursday with a sea of green squares filling its portion of the Sector Carpet. M&I Corp (MI) is the top performer with an 11+ percent gain. Click a square to see the corresponding chart in the upper right... Read More
Don't Ignore This Chart! December 01, 2010 at 04:24 PM
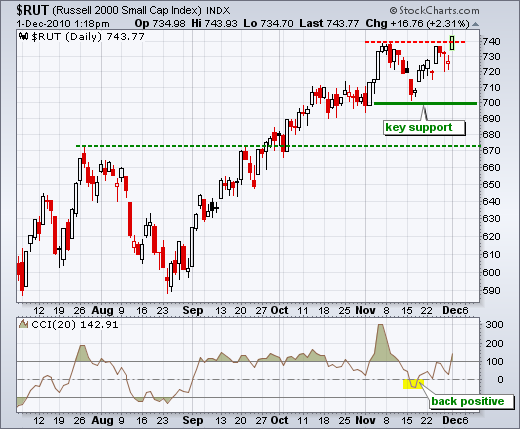
The Russell 2000 ($RUT) and small-caps are leading the market higher. The index is the first of the major indices to break above its November high. With today's move above 740, the index is also challenging its April high... Read More