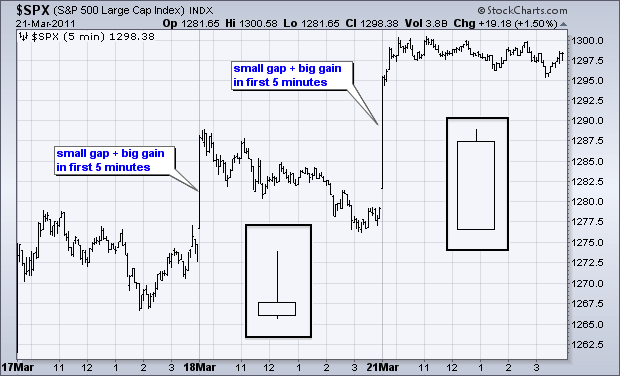
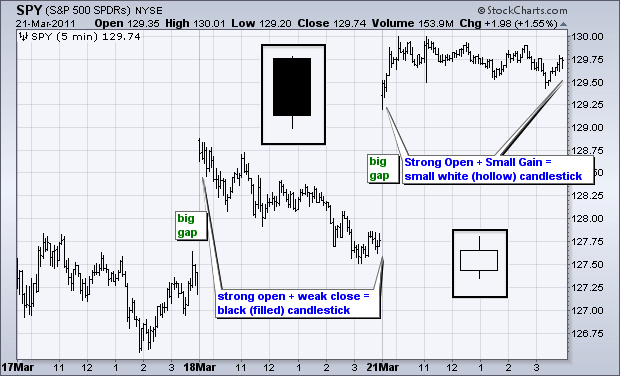
Even though the S&P 500 and the S&P 500 ETF (SPY) track quite well over the medium-term and long-term, daily candlestick action can be quite different. The S&P 500 is an index that prints a price seconds after the market open. More often than not, the S&P 500 prints a price **before all of its components have opened** for trading. This first price does not always reflect market realities, especially when a big gap is expected. Candlesticks on Friday and Monday are quite different for SPY and $SPX. The S&P 500 formed a small white candlestick with a long upper shadow on Friday and a long white candlestick on Monday. Judging from these candlesticks, the S&P 500 showed a weak buying pressure on Friday and strong buying pressure on Monday. **SPY candlesticks paint a completely different story**. SPY formed a long black candlestick on Friday and a small white candlestick on Monday. SPY price action reflects strong selling pressure on Friday and weak buying pressure on Monday. Which one are we to believe?

In contrast to the S&P 500, the S&P 500 ETF open is based on an actual trade. Shares exchanged hands at the opening prices. The S&P 500 open is not based on an actual trade, but rather the index value at the time. Notice how the S&P 500 produced a small gap and surged higher the first five minutes on Friday and Monday. In contrast, SPY produced a big gap on both days. SPY simply opened where the S&P 500 ended after the first five minutes of trading. **A true open makes all the difference with candlesticks**. SPY moved down after its open on Friday and traded slightly higher after its open on Monday. As far as I am concerned, SPY produces more robust candlesticks than the S&P 500.

