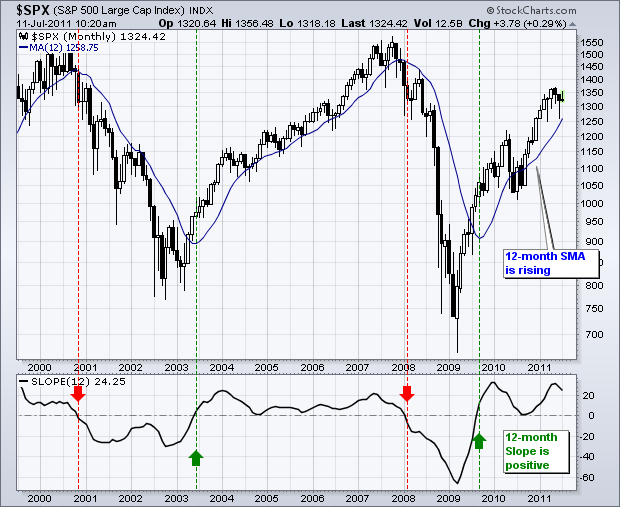
Taking a big step back to look at the big picture, the 12-month Slope indicator for the S&P 500 turned positive in September 2009 and remains positive. While this indicator does not pick exact tops or bottoms, it gives us a good idea of the long-term trend. Note the green and red arrows showing positive and negative crossovers.

Click this image for a live chart

About the author:
Arthur Hill, CMT, is the Chief Technical Strategist at TrendInvestorPro.com. Focusing predominantly on US equities and ETFs, his systematic approach of identifying trend, finding signals within the trend, and setting key price levels has made him an esteemed market technician. Arthur has written articles for numerous financial publications including Barrons and Stocks & Commodities Magazine. In addition to his Chartered Market Technician (CMT) designation, he holds an MBA from the Cass Business School at City University in London.
Learn More


