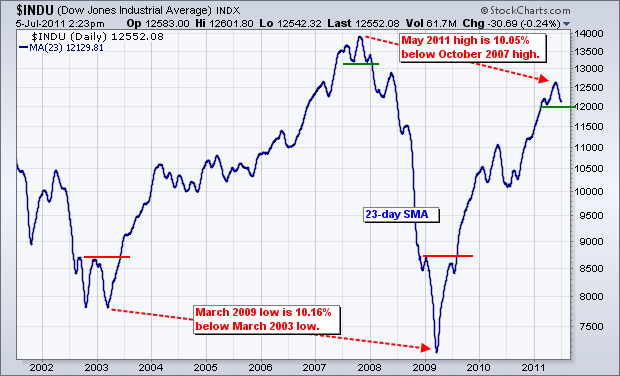
The chart below shows the 23-day SMA for the Dow Industrials. There are around 23 trading days per month and this represents a rolling monthly average. It also smooths daily volatility. The March 2009 low was around 10% below the March 2003 low and the July 2011 high was around 10% below the October 2007 high. 12000 marks the first support to watch for this moving average.

Click this image for a live chart

About the author:
Arthur Hill, CMT, is the Chief Technical Strategist at TrendInvestorPro.com. Focusing predominantly on US equities and ETFs, his systematic approach of identifying trend, finding signals within the trend, and setting key price levels has made him an esteemed market technician. Arthur has written articles for numerous financial publications including Barrons and Stocks & Commodities Magazine. In addition to his Chartered Market Technician (CMT) designation, he holds an MBA from the Cass Business School at City University in London.
Learn More


