Don't Ignore This Chart! October 28, 2011 at 06:19 PM
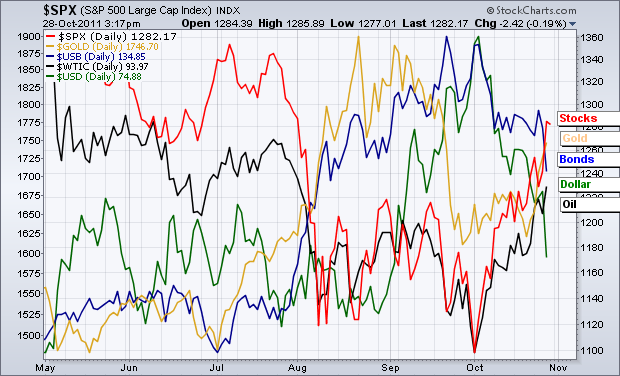
Chartists can measure the market's risk tolerance by comparing the simple line charts for four ETFs... Read More
Don't Ignore This Chart! October 27, 2011 at 04:22 AM
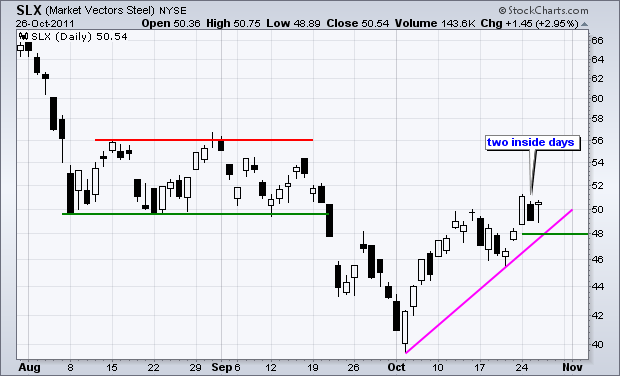
The Steel ETF (SLX) surged above its mid October high with a big move on Monday, but turned indecisive on Tuesday and Wednesday. Notice how Tuesday's candlestick was completely within the range of Monday's. The pattern here is a Harami... Read More
Don't Ignore This Chart! October 26, 2011 at 12:21 PM
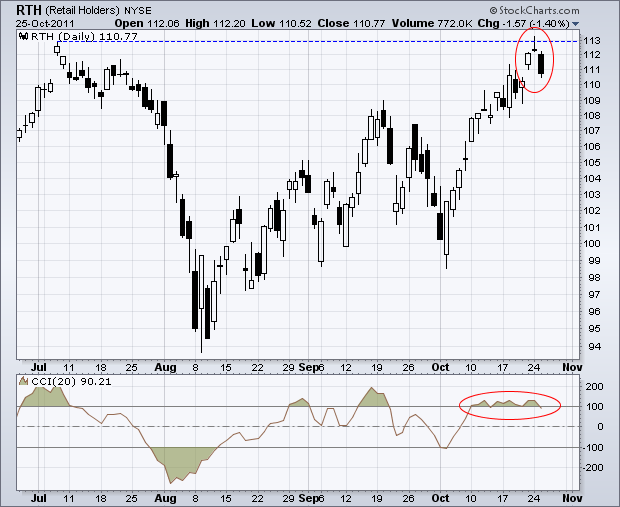
After a surge to the early July high, the Retail HOLDRS (RTH) formed a rare evening doji star. This bearish candlestick reversal pattern features a white candlestick, a doji and a long black candlestick. There are gaps on either side of the doji... Read More
Don't Ignore This Chart! October 25, 2011 at 08:36 PM
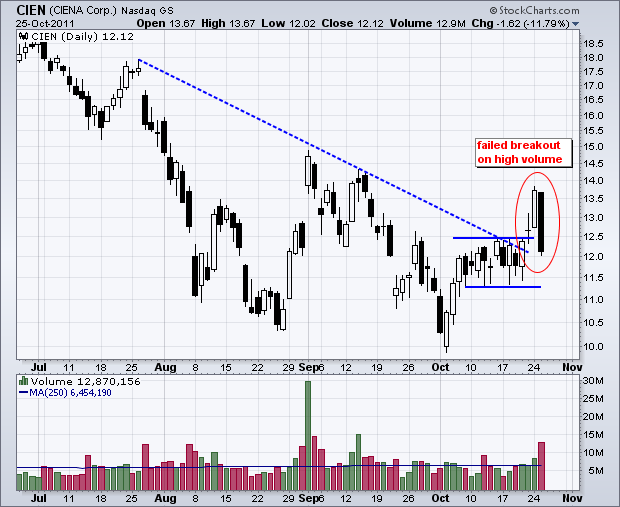
Sometimes a failed signal is as good as a signal. Ciena (CIEN) broke resistance with a surge above 12.50 on Friday-Monday, but failed to hold this breakout after Tuesday's high-volume decline... Read More
Don't Ignore This Chart! October 24, 2011 at 07:53 PM
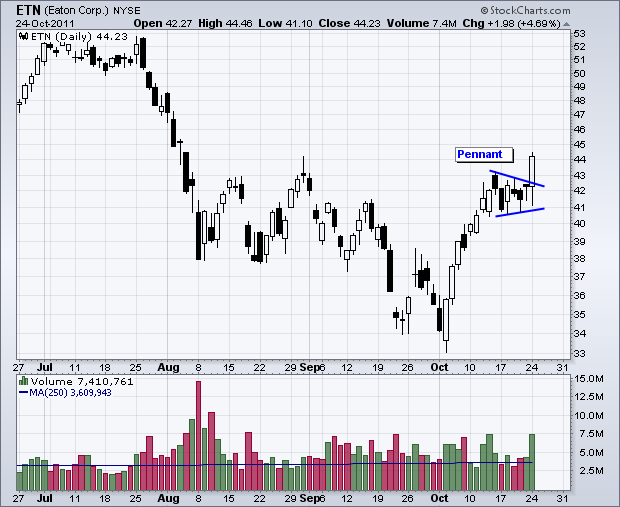
There were a lot of consolidation breakouts the last two days. After a surge the first week and a half of October, many stocks and ETFs consolidated for a week or so. With strength the last two days, these same stocks and ETFs are breaking consolidation resistance... Read More
Don't Ignore This Chart! October 21, 2011 at 10:58 AM
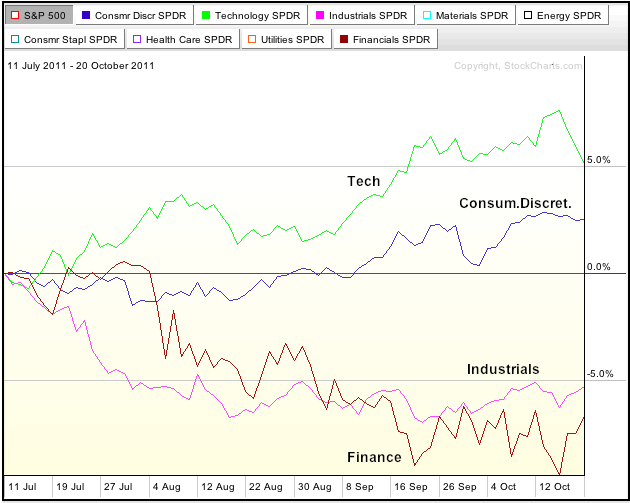
The Sector PerfChart below shows the performance for four sectors relative to the S&P 500... Read More
Don't Ignore This Chart! October 20, 2011 at 05:55 PM
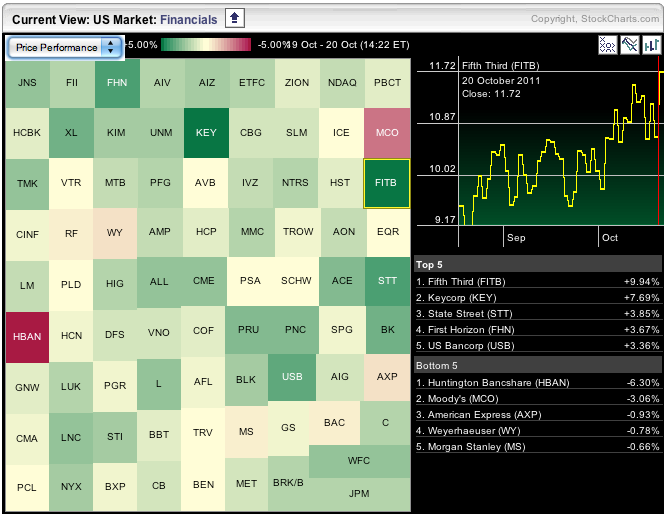
The Finance SPDR (XLF) was leading the market higher late Thursday afternoon. Chartists can check in on the Sector Market Carpet to find the leaders within a particular sector. First, click on the sector heading to isolate the sector... Read More
Don't Ignore This Chart! October 19, 2011 at 01:46 PM
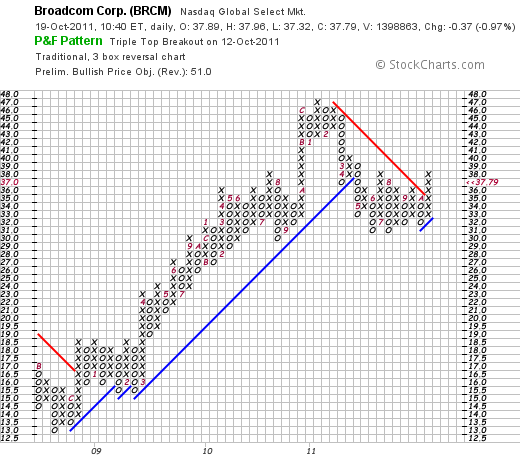
Broadcom (BRCM) triggered a Triple Top Breakout with a move above the September highs on the P&F chart. The stock shows two resistance levels with two X-Columns peaking in the 37 box. The break above the 38 box also broke the Bearish Resistance Line... Read More
Don't Ignore This Chart! October 18, 2011 at 06:22 PM
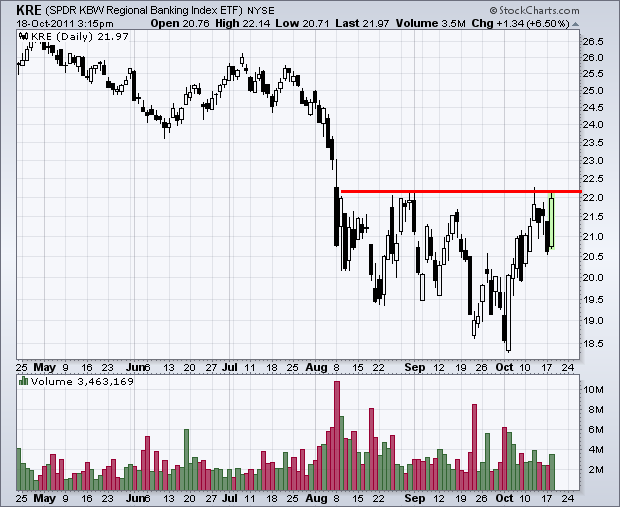
A day after failing at resistance just a day ago, the Regional Bank SPDR (KRE) is right back challenging the late summer highs. KRE dropped below 21 with a sharp decline on Monday, but surged back above 21.50 with an even bigger move on Tuesday... Read More
Don't Ignore This Chart! October 17, 2011 at 08:30 PM
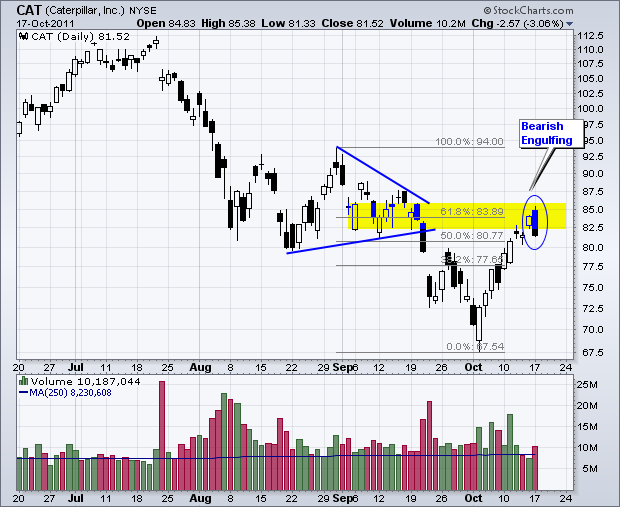
Caterpillar came across the Predefined Scans page with a Bearish Engulfing pattern. This page is updated throughout the day so chartists can find patterns as they happen. CAT formed a Bearish Engulfing with an open above 84 and close below 82... Read More
Don't Ignore This Chart! October 14, 2011 at 12:42 PM
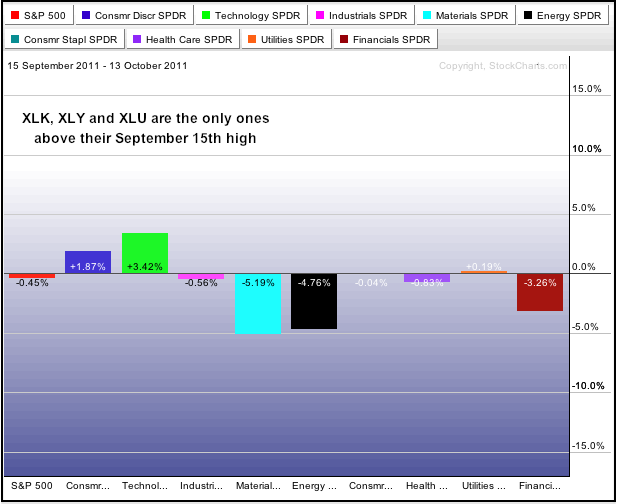
As of Thursday's close, the Technology ETF (XLK), Consumer Discretionary SPDR (XLY) and Utilities SPDR (XLU) were the only sectors SPDRs trading above their September 15th closing high. The S&P 500 was still just below, while the Finance SPDR (XLF) was well below (3.26%)... Read More
Don't Ignore This Chart! October 13, 2011 at 02:35 PM
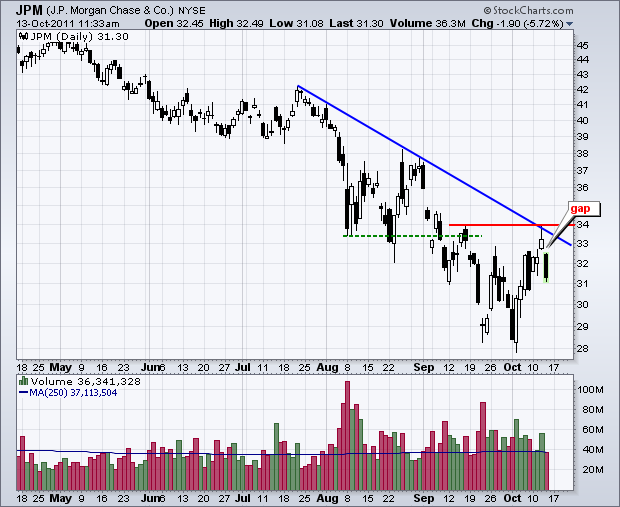
JP Morgan kicked off earnings season for the finance sector with a failure at resistance. After a 10+ percent surge the prior seven days, the stock hit resistance in the 33-34 area and gapped down on Wednesday... Read More
Don't Ignore This Chart! October 12, 2011 at 07:14 PM
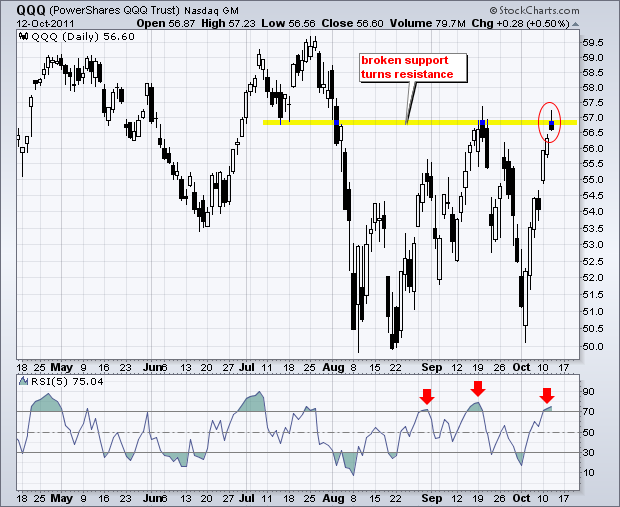
The Nasdaq 100 ETF (QQQ) surged all the way to its September high and formed a small black candlestick with a modest upper shadow on Wednesday. This shows that the ETF moved above 57 intraday, but failed to hold these gains and closed near the low for the day... Read More
Don't Ignore This Chart! October 11, 2011 at 05:39 PM
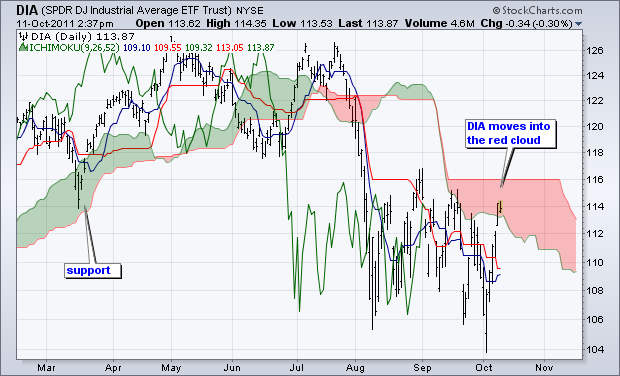
With a big surge the last 5-6 days, the Dow Industrials SPDR (DIA) moved into the red cloud. This chart shows DIA breaking below the cloud in early August. This cloud now turns into a resistance zone that holds the key to the current downtrend... Read More
Don't Ignore This Chart! October 10, 2011 at 05:22 PM
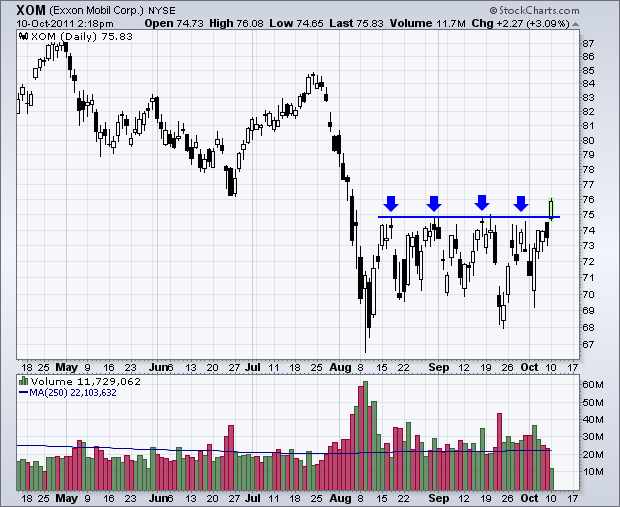
After at least four attempts, Exxon Mobil (XOM) finally broke above 75 and exceeded resistance. This level held from mid August until today. The breakout zone around 74-75 becomes first support. A below 74 would question the validity of this breakout... Read More
Don't Ignore This Chart! October 07, 2011 at 03:47 PM
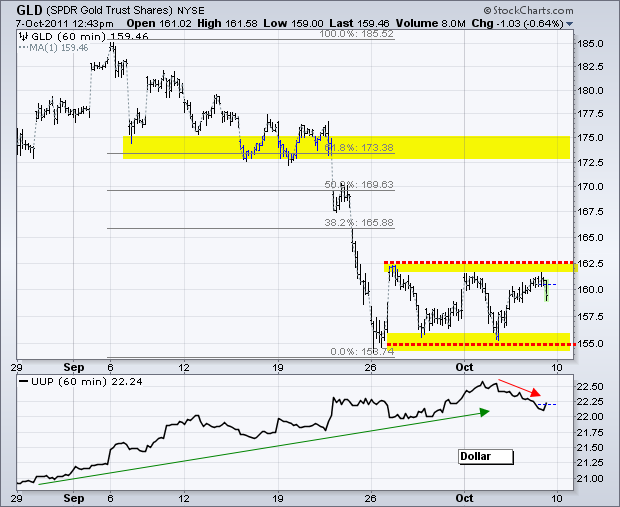
After a sharp decline in September, the Gold SPDR (GLD) moved into a consolidation the last two weeks. Support resides at 155 and resistance 162.50. Traders should watch these levels for the next direction clue. Also watch the Dollar... Read More
Don't Ignore This Chart! October 06, 2011 at 05:40 PM
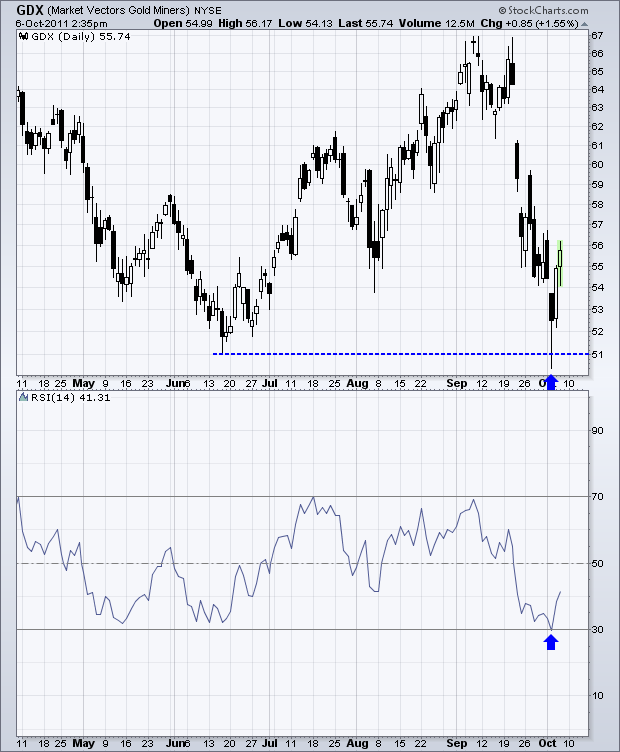
The Gold Miners ETF (GDX) is making waves with an oversold bounce off support the last two days. The ETF briefly broke below its June low on Tuesday, but recovered with the rest of the market and filled the gap with a strong close... Read More
Don't Ignore This Chart! October 05, 2011 at 08:20 PM
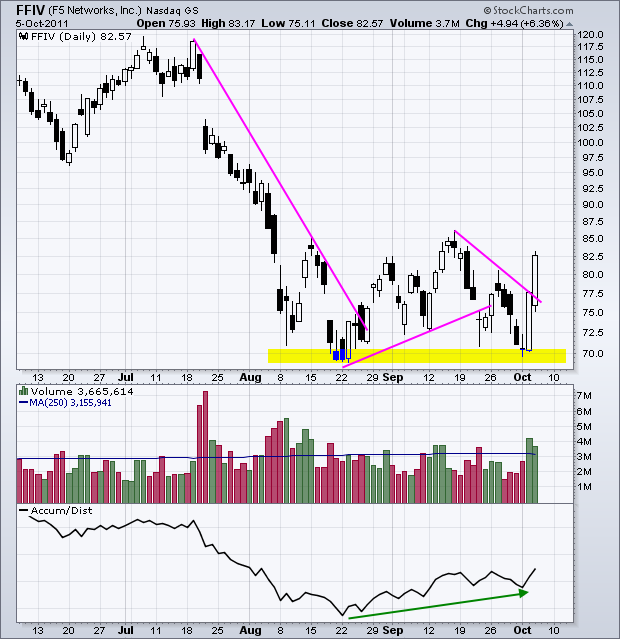
F5 Networks (FFIV) formed a doji near the August low and then surged off this support level with two long white candlesticks. Volume was also above average both days... Read More
Don't Ignore This Chart! October 04, 2011 at 08:01 PM
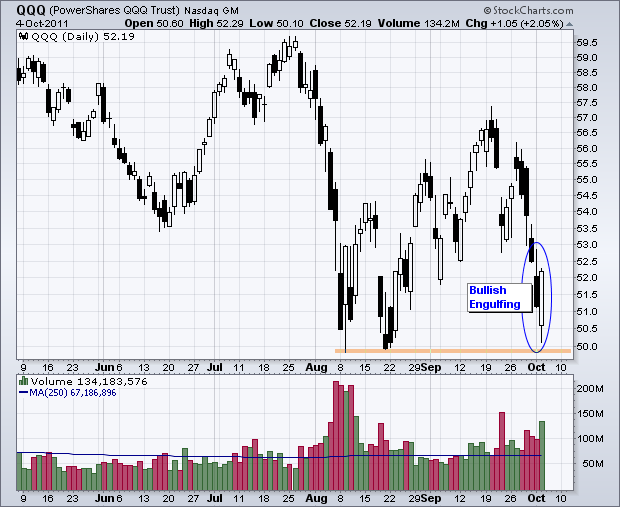
With a lower open and sharp advance in the final hour, the Nasdaq 100 ETF (QQQ) formed a large bullish engulfing on high volume. Also note that this pattern comes with a successful, for now, test of the August lows... Read More
Don't Ignore This Chart! October 03, 2011 at 08:32 PM
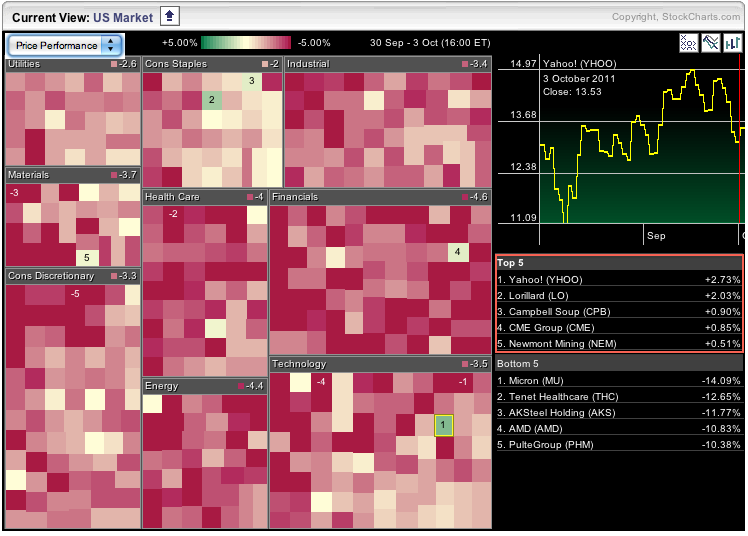
It was a sea of red on Monday as stocks declined sharply. All sectors were down, but there were a few isolated gainers. These can be found on the Sector Market Carpet. Two come from the consumer staples sector (Campbell Soup and Lorillard)... Read More