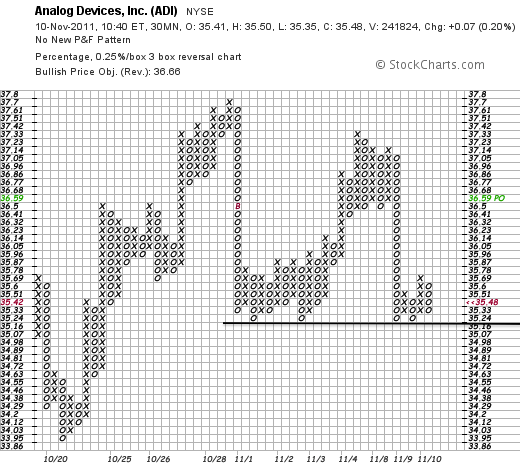
After plunging along with the market early this week, Analog Devices (ADI is trading at support from the early November lows. On this P&F chart, each box represents a quarter percent price change (.25%) and price data is based on the close every 30 minutes. Yes, this is an intraday P&F chart. Support, which is easy to identify on P&F charts, is holding for now and the Double Top breakout remains in play. A break below support would forge a Triple Bottom Breakdown and target lower prices. You can read more on P&F patterns in our ChartSchool.
Click this chart for a live image

About the author:
Arthur Hill, CMT, is the Chief Technical Strategist at TrendInvestorPro.com. Focusing predominantly on US equities and ETFs, his systematic approach of identifying trend, finding signals within the trend, and setting key price levels has made him an esteemed market technician. Arthur has written articles for numerous financial publications including Barrons and Stocks & Commodities Magazine. In addition to his Chartered Market Technician (CMT) designation, he holds an MBA from the Cass Business School at City University in London.
Learn More


