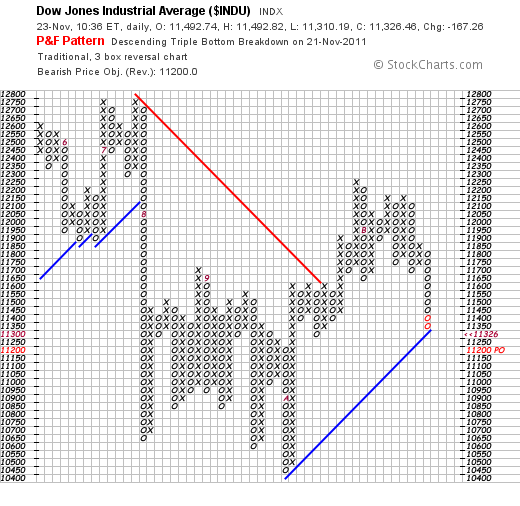
So, how significant is the Dow's recent loss? If you understand the power of P&F charting, you'll get your answer from this chart:
For those that are new to P&F charts, remember that they automatically filter out insignificant price moves. This is misleading to people who are used to looking at bar/candlestick charts and mentally filtering out outlying data. Everything on a P&F chart is significant.
In addition, every column on a P&F chart represents a slanted trend on a regular bar chart and therefore the automatic red and blue trendlines on a P&F chart are trends of trends - highly significant. More on P&F charting
OK - enough background - the bottom line is that if $INDU breaks the current blue uptrend line, it will be technically significant. 11300 is the number (11250 if you want to be conservative).


